Long-term alterations on the physical development of pre- and neonatally undernourished Wistar rats: a functional correlation
- Inicio
- Comité Editorial
- Lineamientos
- Carta de Cesión de Derechos
- Información Legal
- Acerca de la Revista
- Bases de Datos
- Contacto
- ISSN 2007-3054
- Centro de Investigaciones Cerebrales
Universidad Veracruzana
Minerva Ortiz-Valladares1, Claudia A. Salcedo1, Mirelta Regalado Ortega1, Carmen Torrero Solorio1, Manuel Salas Alvarado1*
1Department of Developmental Neurobiology and Neurophysiology, Institute of Neurobiology, National Autonomous University of Mexico, Campus UNAM Juriquilla Querétaro, Mexico.
Resumen/Abstract
Introduction
Materials and Methods
Results
Discussion
References
Mail
La restricción temprana de alimento en la rata interfiere en el largo plazo con el desarrollo físico y la función cerebral, aunque los parámetros del sistema esquelético asociados a la desnutrición pre y neonatal han sido poco estudiados. Se Compararon los efectos de la desnutrición gestacional y por la ligadura materna (UL), con los de la desnutrición en una incubadora (UI) asociada a privación sensorial en el desarrollo físico de ratas Wistar hembras y machos F1 y machos adultos F1. Las madres UL F0 recibieron restricción calórica prenatal de alimento. En la lactancia, una de un par de madres se ligó de sus conductos galactóforos intercambiándose entre las camadas (12 h) con otra sin ligadura. Los sujetos con UI permanecieron en una incubadora durante 12 h. Entre los días postnatales (PDs) 5-90 se midieron los ejes longitud del cráneo, bitemporal, naso-cóccix, cola, tarso-metatarso y longitud de falanges, peso corporal, tamaño corporal medio y apertura palpebral. Los sujetos UL y UI mostraron déficits esqueléticos significativos después de una dieta normocalórica desde el PD 25 hasta el 90 vs. sus controles. Además, mostraron pesos corporales significativamente bajos tanto en los sujetos UL hembras o machos, como en los sujetos con UI al compararse ambos grupos. El índice de masa corporal (BMI) en el día PD 90 en hembras con UI mostró un porcentaje mayor vs. sus controles. Se sugiere que la desnutrición perinatal alteró el desarrollo físico de los sujetos F1, afectando su actividad sensoriomotora y las respuestas adaptativas sociales tardías.
Palabras clave: Desnutrición temprana, Desarrollo físico, Ratas, Manipulación sensorial, Crecimiento.
Early food restriction resulted in long-term consequences on physical and brain development. However, long-term skeletal maturity parameters interacting with sensory deprivation are scarcely described. We compare the effects of gestational undernutrition and postnatal ligature (UL) and neonatal undernutrition by using an incubator (UI) with sensory deprivation on the physical development of suckling and adult F1 female and male Wistar rats. UL F0 subjects were submitted to caloric food restriction during the gestational period and suckling of dams, one with nipple-ligated and interchanged every 12 h. UI subjects were underfed by placing pups into one incubator for 12 h. Skull, nose-coccyx, tail, tarsus-metatarsus, phalange lengths, bitemporal axis, body weight, mean body sizes and eyelid opening were measured on postnatal days (PDs) 5-90. UL and UI subjects resulted with significant skeletal deficits following a normocaloric diet from PD 25 in most of the ages from PDs 5 to 90 of the study compared with their controls. Furthermore, significant low body weights in both female and male UL groups throughout the lactation period, compared to normally feeding rats were obtained. Body Mass Index (BMI) on PD 90 in female UI subjects showed higher percentages than controls. The findings indicated that gestational undernutrition of F0 dams resulted in consistent, long-term altered physical development of F1 subjects that might interfere with their body growth, sensorimotor activity and possibly with the late social adaptive responses.
Keywords: Early undernutrition, Physical development, Rats, Sensory manipulation, Growth.
Developing rats are highly influenced by numerous environmental factors that disrupt functional brain processes and interfere with the physical and adaptive capacities that persist into adulthood. Among these factors, prenatal and suckling food restriction have shown long-term consequences including prenatal stress, abnormal hormone release, early handling, sensory deprivation and disrupted mother-litter bonds, among others.1-6 During fetal development, the placenta modulates the demand for nutrients and oxygen supply and sends signals to the mother, who transfers the nutrients to the fetus.7,8 It is well established that the nutritional needs of dams increase during gestation due to the demands of the growing fetus and the preparation of the mother for lactation. The embryonic and fetal stages are critical time windows for the fetus, as nutritional deficiencies can affect its growth by interfering with placental intrauterine development.9,10 The effects of undernutrition depend on the period in which food restriction is introduced. Thus, the energy expenditure during the anabolic stage of gestation is low because the fetus undergoes its early organic assembly; but during the catabolic stage, growth and maturation of the individual is strong, hence the energy expenditure is high, and deficient food supply results in severe fetal intrauterine growth retardation.11
In humans, optimal nutrition in the perinatal stages, which include gestation and the first years of life, are necessary for proper physiological development. During this period, basic cytogenetic processes for cerebral and physical maturation will guarantee the correct cognitive and motor abilities and social emotional responses for the future.12,13 There is evidence that early undernutrition can affect many aspects of brain growth including neurogenesis, synaptogenesis, neurotransmitter release and myelination.14-17 Furthermore, physical and cognitive alterations have been identified in individuals who suffered early undernutrition, since in utero epigenetic changes are carried forward through adolescence and adulthood, affecting successive generations.18-20 For these reasons, investigation of epigenetic mechanisms in the context of environmental food restriction, associated with sensory deprivation, mother-litter alterations and stress exposure are needed, particularly research on the effects of physical allometric measurements and parameters of somatotropin postnatal growth.
Several studies using different food restriction paradigms have emphasized that the effects of neonatal undernutrition on brain development are more severe than those occurring during gestation, possibly because there are protective maternal mechanisms to attenuate the noxious effects and long-term consequences on the pup’s brain.21,22 Although the effects of prenatal and/or pre- and post-weaning undernutrition, late prenatal or suckling malnutrition on body and brain development have been investigated, the negative impacts on long-term skeletal maturity parameters transmitted through epigenetic mechanisms are scanty, partly rehabilitated, permanent or poorly understood.21, 23-30
The aim of this study was to compare the effects of perinatal food restriction that minimizes sensory deprivation, with the preweaning daily removal of half of the litter (4 out of 8 pups) into an incubator, a procedure including undernutrition plus severe sensory deprivation on the lasting physical development of rats from birth to weaning not previously compared. These physical alterations may be underlying the long-term deficiencies in social interactions, reproductive behavior and motor abilities.
Experimental procedures and protocols were approved by local Animal Committees and adhered to the National Research Council guide for the care and use of mammals (NCR 2003).31
Animals. Female (F) and male (M) Wistar rats from 5 to 90 days old were used to assess the physical development of the F1 generation. The F0 female rats were mated and the sperm-positive females were placed individually in a translucent plastic maternity cage (50 × 40 × 20 cm3) with wood shavings as nesting material. The day after birth was defined as PD 1, and pups from different litters were randomly mixed, weighed and sexed. Five females and five males from each litter were randomly distributed among lactating dams until weaning to minimize genetic and nutritional differences that may influence the experimental results. Animals were maintained in an automatically controlled room at 22°C ± 2°C and 50 % humidity on a 12 h light/12 h dark cycle (lights on at 07:00 h), with water and food (5001 rodent Purina chow) ad libitum.
Diet composition. Both Control Group (CG) and Undernourished Group (UG) received the same type of diet Lab Diet 5001 (St. Louis, MO) with reduced percentage only in the UL group as described below.32
Nutritional procedures. The CG consisted of male and female rats obtained from ten normally fed subjects, nursed by well-fed mothers with free access to food and water. Two control groups were carried out for both undernourished methods. In the first one, pups after birth were fed and handled by interchanging a pair of normally lactating dams every 12 h (at 08:00 and 20:00 h) as described elsewhere.33 For the second group, pups were placed into an incubator during 3 min span (at 8:00 h) from PDs 1-25. In this study only the first control group described above was used for the statistical analysis since no differences were found between groups (unpublished results). For the UG subjects, two nutritional paradigms were used. In the gestational undernutrition and postnatal nipple ligature (UL) group, F0 dams were fed from gestational day 6 (G6) to G12 with 50% (9.5 g) of the normal diet from G13 to G19 with 70% (13.3 g) and with 100% (19 g) until parturition to avoid reabsorption or cannibalism of pups. This requirement was calculated by measuring the food intake of a group of 6 pregnant control rats during the gestational period. This protocol was chosen because neurogenesis and connectivity in the cortical and subcortical reflex and motoric mechanisms occur mainly from G16 to G21.34 On PD 1, one of two gestationally underfed dams had the main galactophorous ducts tied subcutaneously, and the two lactating dams were swapped every 12 h between litters until PD 24.17 Weaning was performed on PD 25 and F1 pups were fed ad lib and maintained in groups of 4-6 rats until PD 90. Approximately 80% of the total underfed subjects included here were undernourished during the light phase of the cycle. In the postnatal undernutrition by separating pups into an incubator (UI) group, F0 dams were fed ad lib during the entire gestational period. On PD 1, two female and two male pups per litter were selected and marked with a color to take part in the undernourishment procedure. Meanwhile, the rest of the litter remained in their home cage with their dam to minimize the maternal lactation disturbances. From PDs 1 to 24, F1 marked pups were separated from their dams for 12 h (from 08:00 to 20:00 h) and placed into an incubator (Lab Line, India) maintained at 28°C ± 2°C (Figure 1). Weaning was performed on PD 25.
Physical development measurements. A total of 23 male and 23 female rats per nutritional status (CG, UL, UI), randomly chosen from 10 litters, were evaluated for physical development on PDs 5, 10, 15, 20, 25, 30 and 90. Brain, body weight, size and BMI were assessed on PD 90. Physical measurements and body weight of the pups were carried out between 10:00 and 14:00 h under home cage conditions. Two observers blindly took all measurements involved in the treatment and had no knowledge about the hypothesis of the experiment.
Eyelid opening. The eyelid opening of pups was tested from PDs 13 to 16 using a scale of (1) when eyelids were closed; (2) when they were 50% open; and (3) when they were fully open.
Body lengths. Measurement of all body lengths of the animals was done with a special plastic anatomic tape (0.5 cm width) used for body composition analysis. The physical development measurements included skull length, from the anterior border of the foramen magnum to the tip of the nasal bones,35 nose-coccyx length, from the foramen magnum to the first coccygeal vertebrae; tail length, all coccygeal vertebrae; tarsus-metatarsus and phalange length, the length summation of these three components; bitemporal axis, measured from the external ear canal (left to right) following the interaural line (Figure 2); size (length), the sum of the nose-coccyx length and tail length; BMI, weight (g) by body length squared (cm2).
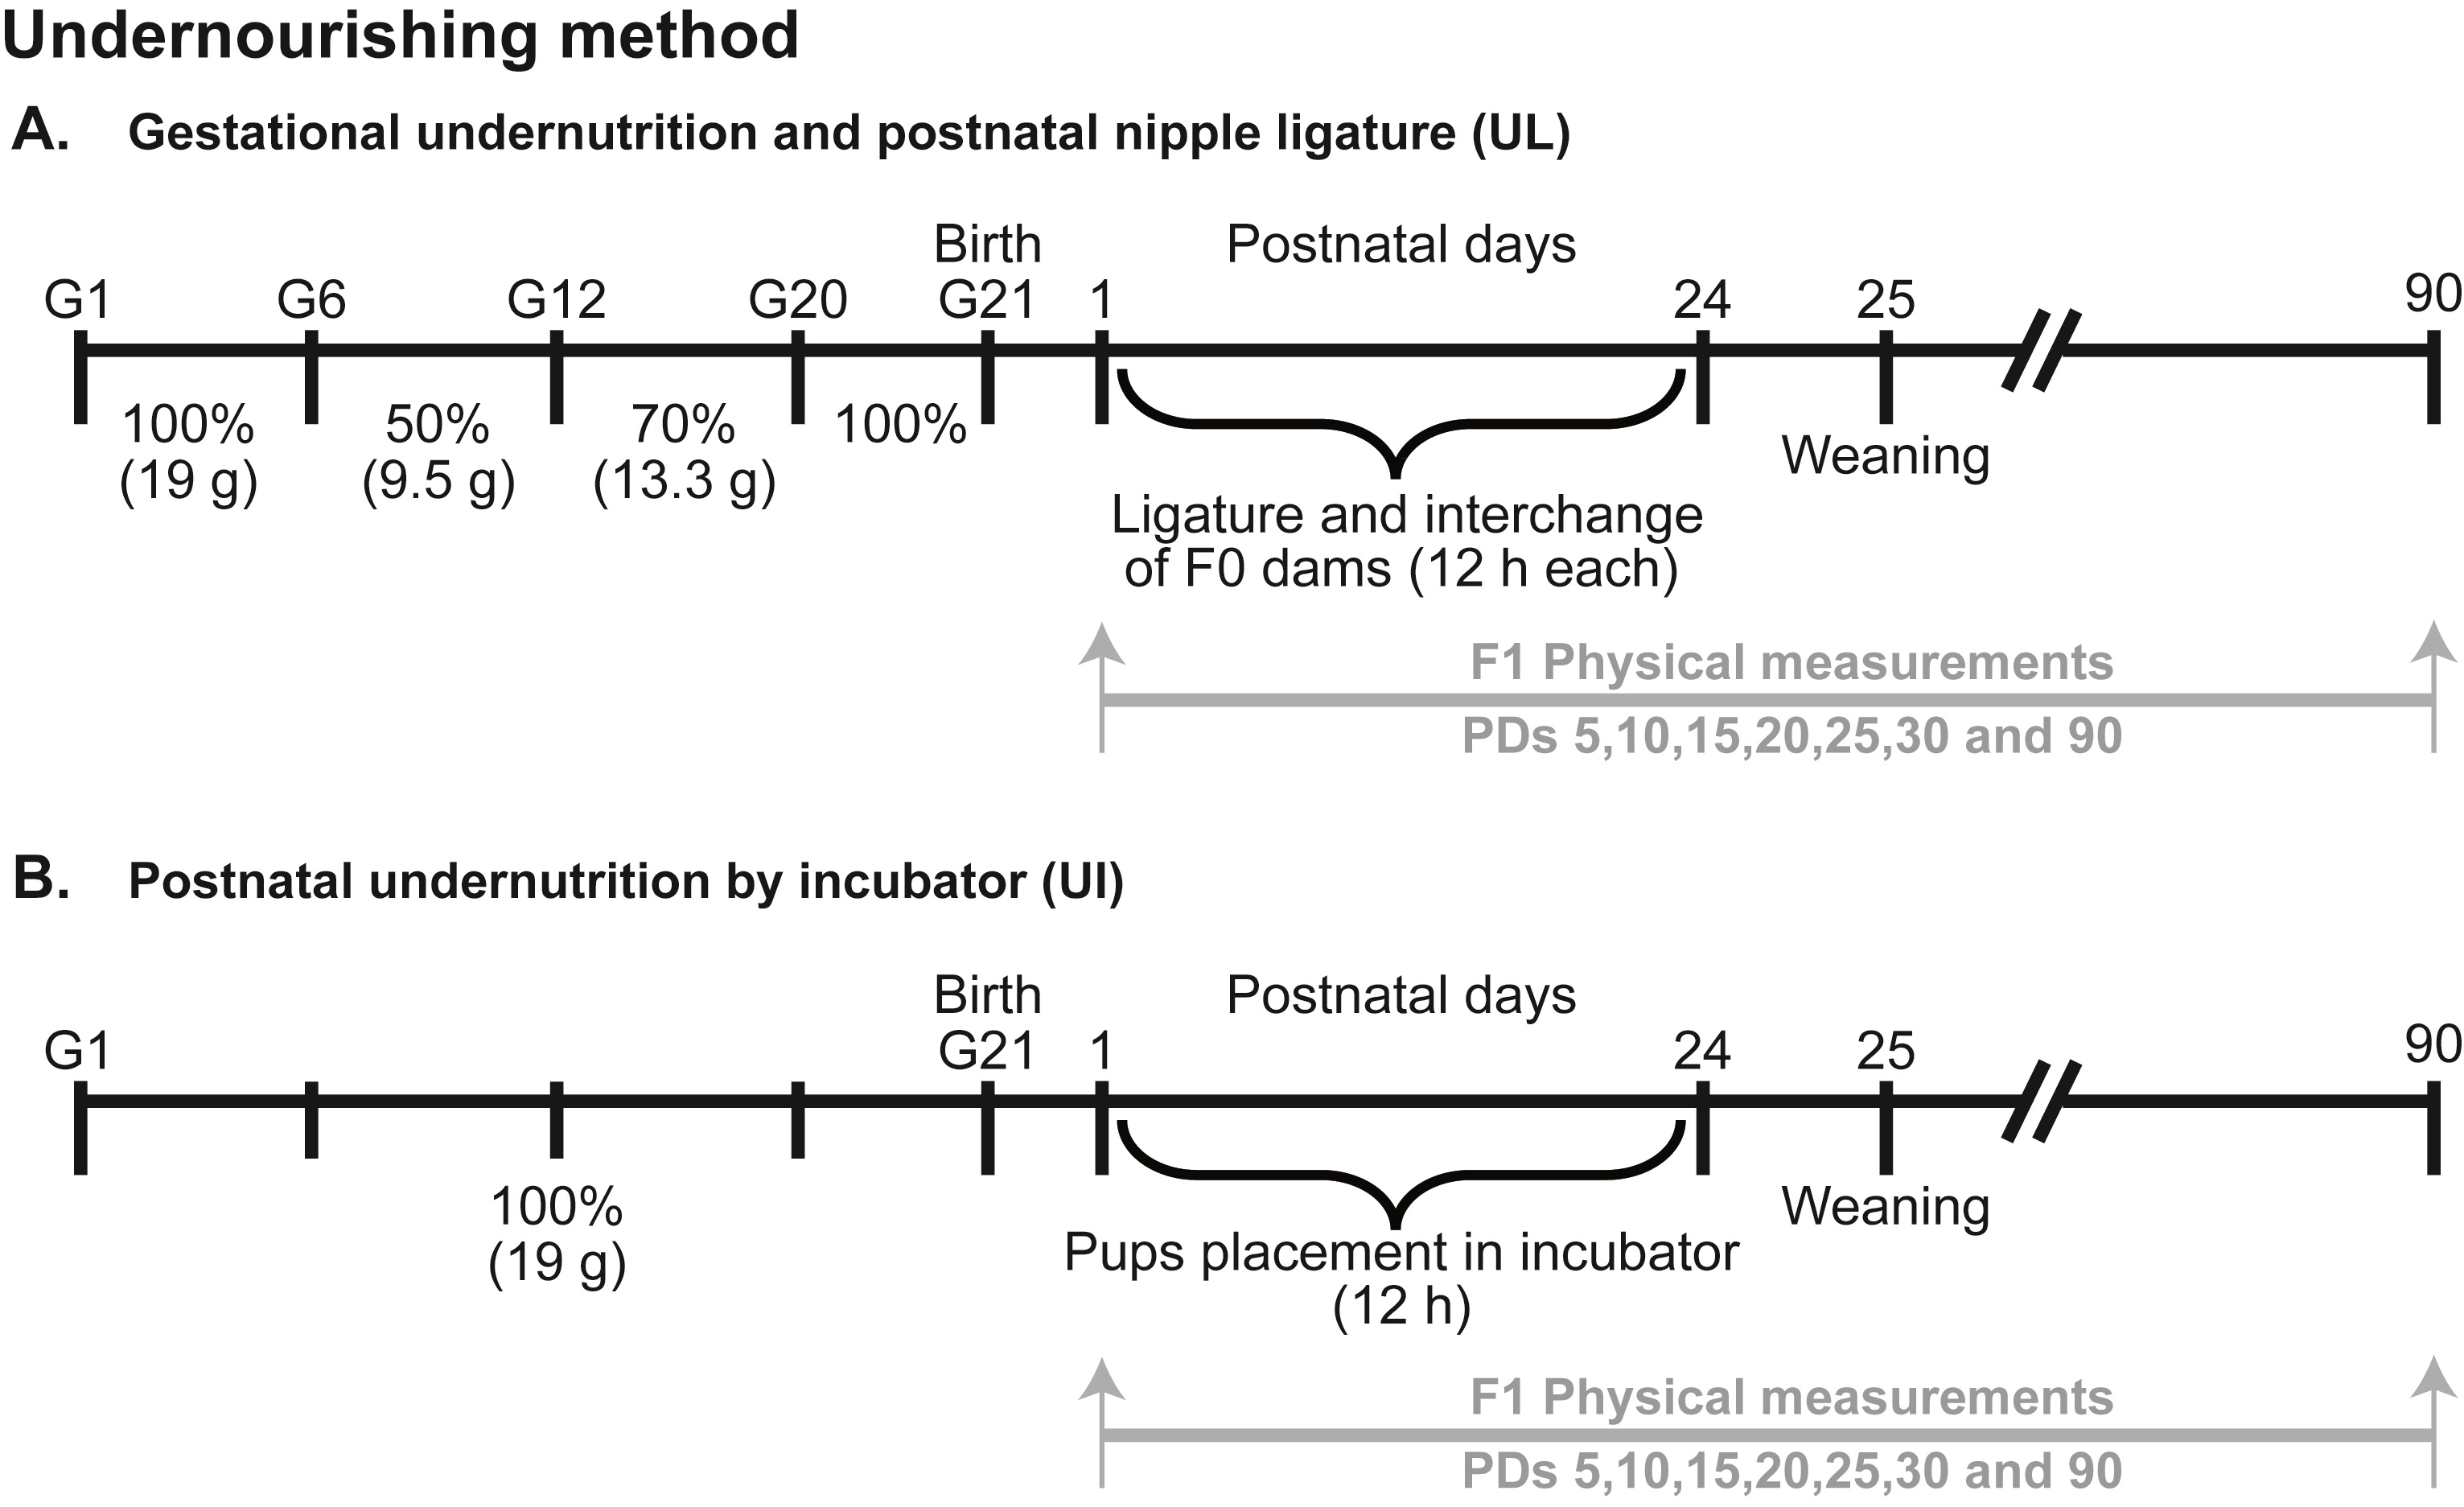
Figure 1. Experimental design for A. Gestational undernutrition and postnatal nipple ligature (UL); B. Postnatal undernutrition by partly separating half of the litter into an incubator (UI).
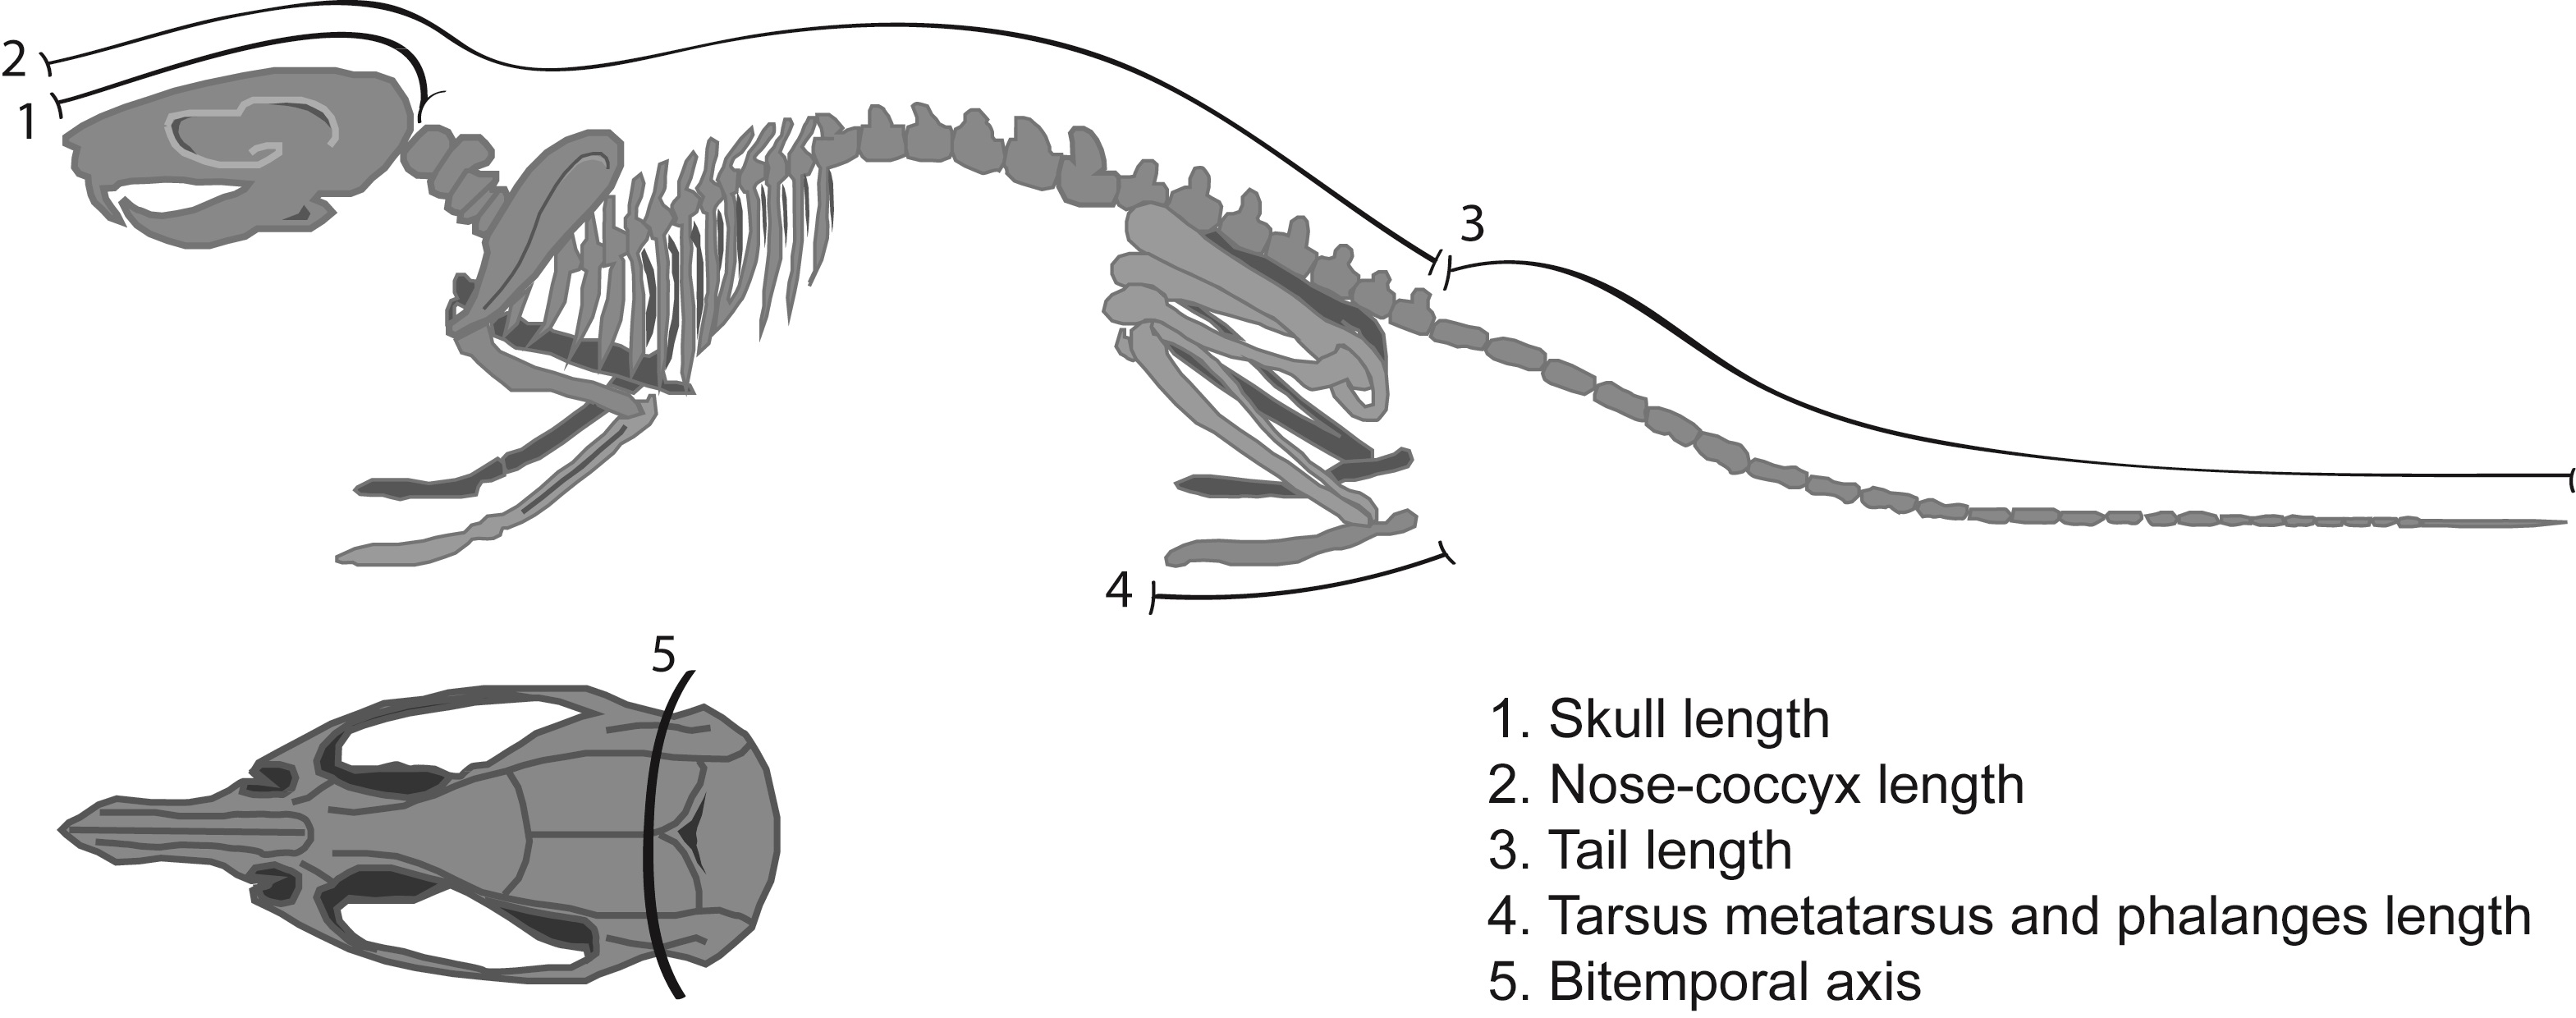
Figure 2. Schematic representation of the skeletal lengths measurements.
Cerebral weight, body weight, size and BMI on PD 90. After deep ether anesthesia the cerebral wet weight, size and BMI were measured on PD 90 for the F1 generation. The body weight of the female and male F1 rats was evaluated on PDs 5, 10, 15, 20, 25, 30 and 90 between 10:00 – 11:00 h.
Statistical analyses. Experimental measurements were analyzed with the Statistical Package version 7.0 to compare differences between nutritional paradigms and sexes. For the eyelid opening, a Mann–Whitney U test was used. The results of the body axis lengths were analyzed with a three-way ANOVA test, 3(nutritional regimes) x 6(ages) x 2(sexes) followed by a Tukey post hoc test. The body weight measurement was analyzed with a three-way ANOVA test, 3(nutritional regimes) x 6(ages) x 2(sexes) followed by a Tukey post hoc test. Pearson correlation was also used to determine the relation between the body weight and height of subjects. Cerebral wet weight was analyzed with a two-way ANOVA test, 3(nutritional regimes) x 2(sexes) and a Fisher's LSD post hoc test. Body weight, size and BMI on PD 90 were analyzed with a two-way ANOVA, 3(nutritional regimes) x 2(sexes) and a Tukey post hoc test. The significant threshold for all comparisons was set at p<0.05.
Body lengths. The skull length of the three groups (CG, UL and UI) of F1 pups gradually increased during development with significant reductions from PDs 5 to 30 in both experimental groups, F(1,792) = 433.54, p<0.0001, affected by age, F(1,792) = 3100.97, p<0.0001; sex, F(1,792) = 74.77, p<0.0001; and interaction diet x age x sex, F(1,792) = 11.44, p<0.0001. Post hoc comparisons between groups indicated significantly (p< 0.05) reduced length in UL female pups on PDs 5 to 25 and UL male pups on PDs 5, 10, 20, 25 and 30, and on PDs 5 to 30 in UI female pups and PDs 5, 10, 25 and 30 in UI male pups. Comparisons between the UL and UI experimental groups indicated significant differences on PDs 10 and 20 for female pups and on PDs 10 and 30 for male pups. Moreover, comparisons between sexes of the same group indicated significant differences on PD 10 for the CG group, and on PDs 20 and 25 for the UL group (Table 1). Comparisons between UL and UI groups yielded reduced nose-coccyx length in both, F(1,792) = 723.97, p<0.0001; with significant effects on age and sex, F(1,792) = 4142.45, p<0.0001, F(1,792) = 89.40, p<0.0001 respectively; and between all factors, F(1,792)= 1.87, p<0.0459. Post hoc comparisons between groups indicated a significant decrement (p<0.05) in length throughout development on PDs 5 to 30 in both experimental groups and between sexes. Comparisons between female and male pups from the CG group on PDs 15 to 30 were also significant (Table 1). Concerning the tail length, there were significant reductions in UL and UI groups, F(1,792) = 505.61, p<0.0001; effects on age, F(1,792) = 5514.84, p<0.0001; on sex, F(1,792) = 31.66, p<0.0001; and between all factors, F(1,792) = 2.91, p<0.0013. Post hoc comparisons indicated a significant decrease (p<0.05) on PDs 5 to 30 in UL female and male pups, from PDs 10 to 30 in UI males and from PDs 15 to 30 in UI females. Comparisons between UL and UI indicated significant differences on PD 25 in male pups. Furthermore, significant decreases between sexes of the same group were found on PDs 10, 15 and 25 in the CG group and on PD 25 in the UL group (Table 1). The ANOVA comparisons for tarsus-metatarsus and phalange lengths showed reductions in both experimental groups, F(1,792) = 384.90, p<0.0001; effects on age, F(1,792) = 3969.39, p<0.0001; sex, F(1,792) = 100.59, p<0.0001; and interaction between factors, F(1,792) = 2.94, p<0.0012. Post hoc comparisons indicated significant differences (p<0.05) on PDs 5 to 30 in both female and male UL pups and in female UI pups on PDs 5, 10 and 30, and on PDs 5, 10 and 20 in UI males. Significant differences were found between both sexes in UL and UI groups on PDs 15, 25 and 30. Comparisons between sexes of the same group indicated a significant reduction on PDs 10, 20 and 30 in the CG group and on PD 10 in the UL group (Table 1). For the bitemporal axis, comparisons indicated significant reductions in UL and UI groups,F(1,792) = 1572.60, p<0.0001; effects on age, F(1,792) = 2962.97, p<0.0001; sex, F(1,792) =10017, p<0.0001; and between factors, F(1,792) = 8.05, p<0.0001. Post hoc comparisons indicated a significant decrease (p<0.05) on PDs 5 to 20 and 30 in UL females, on PDs 10 to 20 and 30 in UL males, and from PDs 10 to 30 in both female and male UI rats. Comparisons between experimental groups indicated significant differences on PDs 10, 20 and 30 in female pups and on PDs 20 and 30 in male pups. Significant reductions were found between sexes of the same group on PDs 10 and 30 in the CG group and on PDs 10 and 20 in the UL group (Table 1). Comparisons between groups indicated a decrease in both experimental groups, F(1,792) =64.54, p<0.0001; with effects on age, F(1,792)= 271.55, p<0.0001; and sex, F(1,792) =14.86, p<0.0001; and without in teraction between factors. Post hoc comparisons indicated a reduction (p<0.05) on PD 25 in UL females and on PDs 10, 20 and 25 in UI males and PDs 20 and 25 in UI females. Comparisons between UL and UI indicated a significant difference on PDs 15 and 25 in male pups (Table 1). Correlations between body weight and size and body weight and height. Comparisons between groups indicated a gradual reduction of body weight during development in UL and UI groups, F(1,792) = 943.28, p<0.0001; age, F (1,792) = 4565.44, p<0.0001; sex, F(1,792) = 113.31, p<0.0001; and between factors, F(1,792) = 3.62, p<0.0001. Post hoc comparisons indicated a reduction (p<0.05) of body weight gain from PDs 10 to 30 in both UL and UI female and male pups (Figure 3, A). Comparisons be tween UL and UI showed a significant difference on PDs 25 and 30 in male pups. Differences between sexes of the same group were found on PD 25 in CG and on PDs 25 and 30 in UL. Regarding size length, the comparison indicated a significant decrease in both experimental groups throughout development, F(1,792) = 1045.93, p<0.0001; with significant effects on age and sex, F(1,792) = 8012.09, p<0.0001; F(1,792) = 101.22, p<0.0001, respectively; and interaction diet x age x sex, F(1,792) = 1.80, p<0.0463. Post hoc comparisons indicated a reduction (p<0.05) from PDs 5 to 30 in both UL and UI female and male pups (Figure 3, B). Furthermore, comparisons between experimental groups showed significant differences on PDs 25 and 30 in male pups, and significant differences between sexes of the same group on PDs 10 to 25 in CG and on PD 25 in UL. Body weight of female F1 rats at PD 30 was positively correlated with height only in the UL and UI groups and in the total of the three groups (UL r = 0.4780, p<0.0211), (UI r = 0.8684, p<0.0001) and (r = 0.7909, p<0.0001) (Figure 3, C). Additionally, correlation values in male offspring were positively correlated only in the UI group and in the total; (UI r = 0.8456, p<0.0001) and (r = 0.6870, p <.0001) (Figure 3, D). Cerebral weight, body weight, size and BMI on PD 90. The cerebral weight of both female and male rats in UL and UI groups showed a significant reduction on PD 90, F(1,27) = 22.45, p<0.0001; with significant effects on sex and interaction between factors, F(1,27) = 123.66, p<0.0001 and F(1,27) = 4.02, p<0.0296. Post hoc comparisons indicated a reduction in the UL and UI groups in both female and male rats, and a significant difference between experimental groups only in the females. Moreover, significant differences were found between sexes in the CG, UL and UI groups (Figure 4, A). The ANOVA comparisons between groups indicated a significant reduction of body weight on PD 90, F(1,66) = 318.32, p<0.0001; sex, F(1,66) = 2389.07, p<0.0001; and interaction between factors, F(1,66) = 60.74, p<0.0001. Post hoc comparisons indicated a significant reduction (p<0.05) in female and male rats of both experimental groups, and significant differences were found between sexes in all groups (Figure 4, B). Comparisons between groups indicated a decrease on PD 90, F(1,66) = 298.2, p<0.0001; with significant effects on sex and between factors, F(1,66) = 607.5, p<0.0001, and F(1,66) = 12.0, p<0.0001. Post hoc comparisons showed a decrease in both sexes and experimental groups. Between UL and UI groups, a reduction was found only in female rats (p<0.05), and significant differences were observed between sexes in all groups. Significant differences between the BMI of both experimental groups were found on PD 90, F(1,66) = 9.73, p<0.0002; and between sexes and factors, F(1,66) = 172.14, p<0.0001, and F(1,66) = 45.68, p<0.0001, respectively. Post hoc comparisons indicated a BMI significant increase (p<0.05) in the UI group only in the female rats, and a significant reduction (p<0.05) in UL and UI males. Also, significant differences were found between UL and UI only in female rats. Moreover, differences were found between sexes only in the CG and UL groups (Figure 4, C).
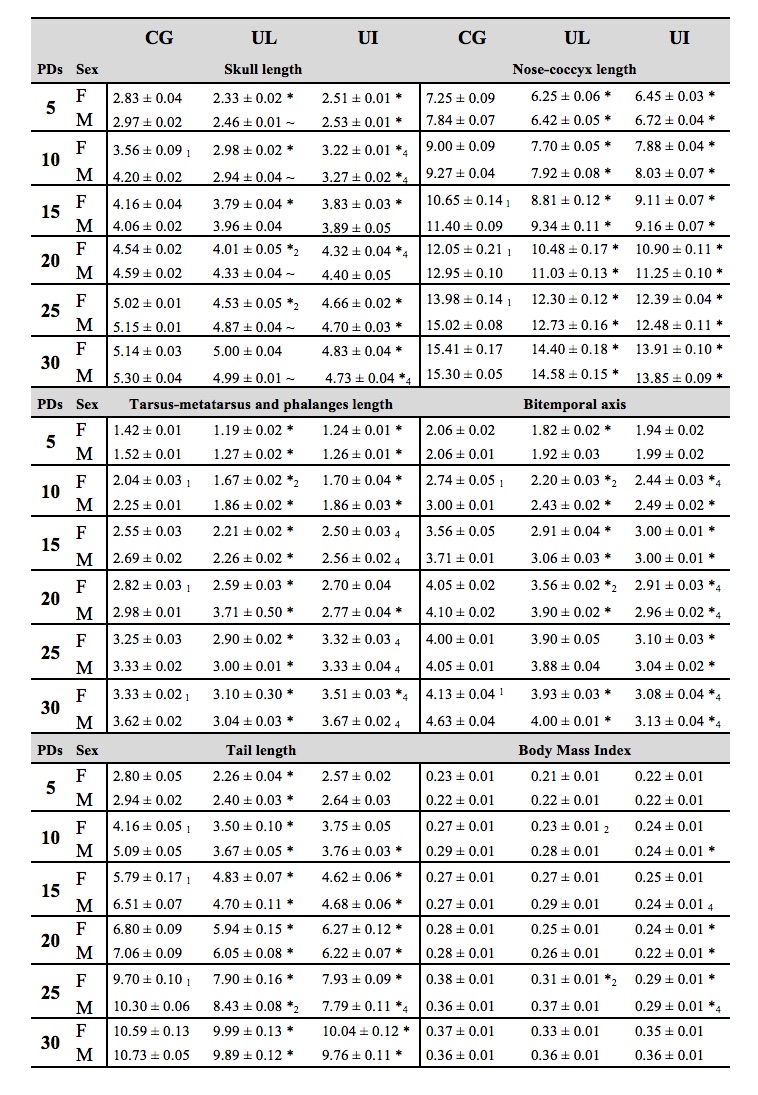
Table 1. Mean (± SEM) of body lengths (cm) in CG, UG, and UI female and male pups on PDs 5-30. (n= 23 per condition). * p <0.001 CG vs. UL or CG vs. UI; ~ p <0.01 CG vs. UL or CG vs. UI; (1) p <0.01 F CG vs. M CG;(2) p < 0.01 F UL vs. M UL; (3) p < 0.01 F UI vs. M UI not shown; (4) p < 0.01 UL vs. UI.
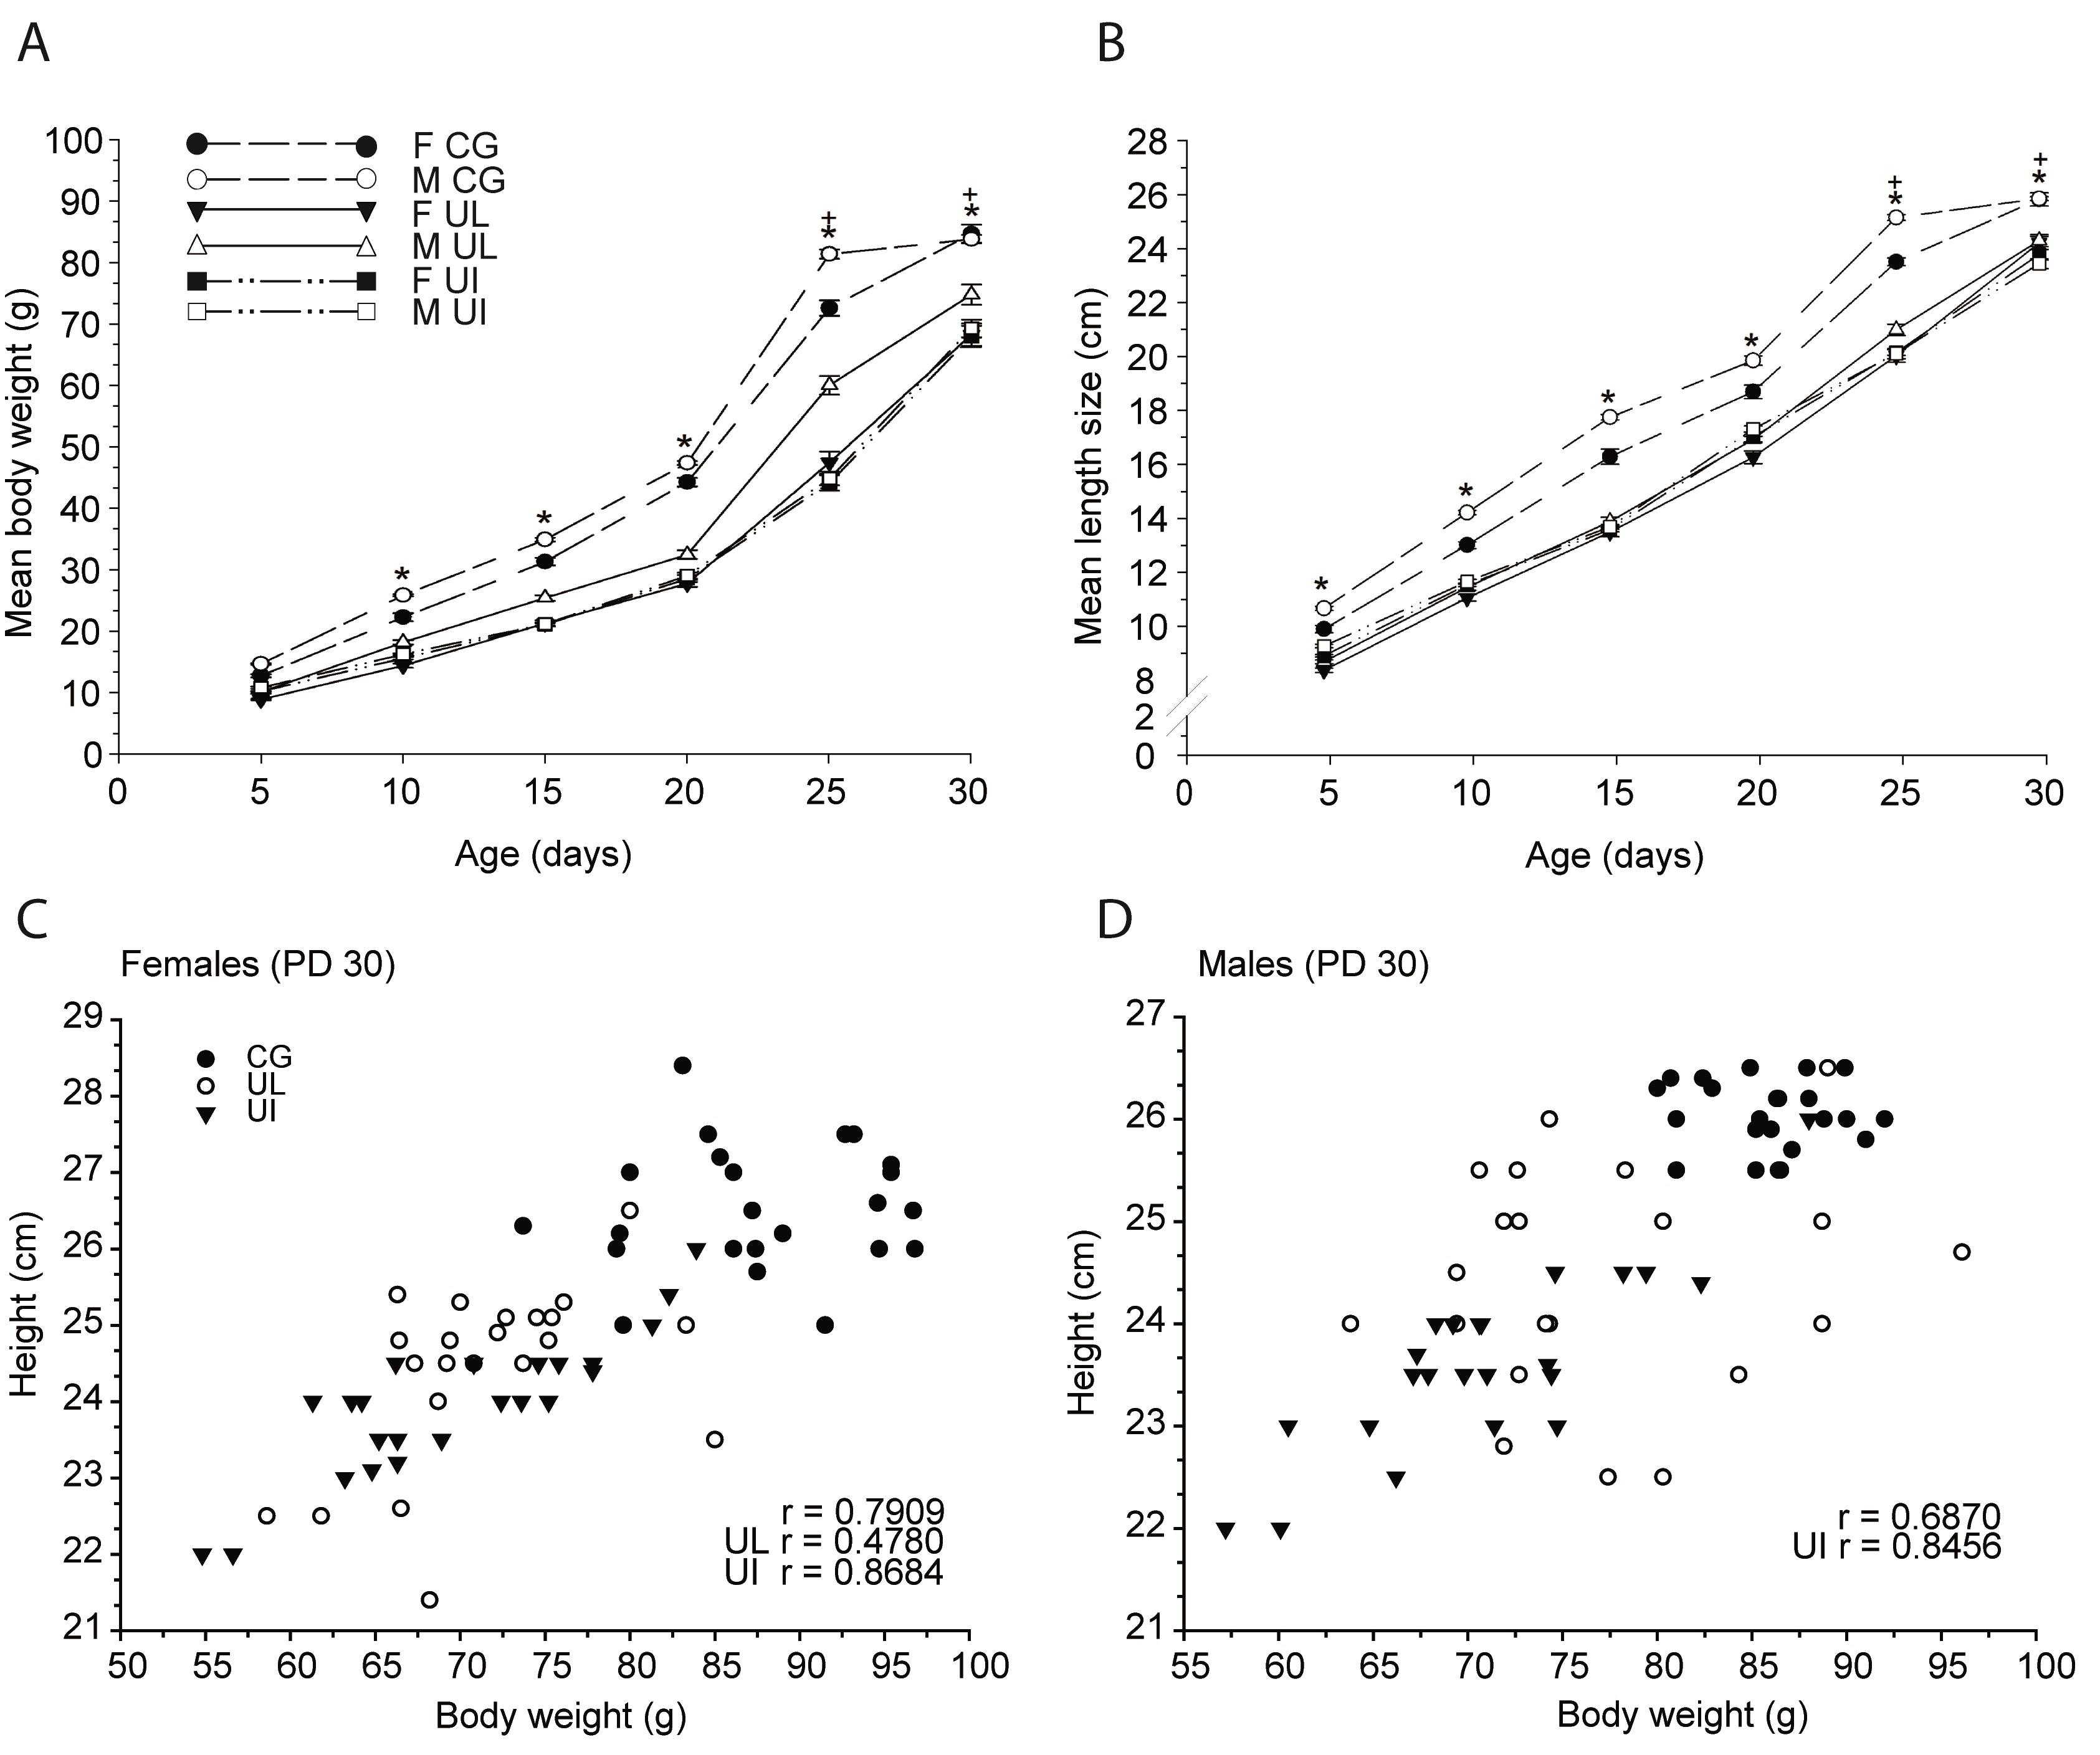
Figure 3. Mean (± SEM) of body weight in CG, UL and UI female and male pups on PDs 5 to 30. B) Mean length size. * p<0.001 CG vs. UL or CG vs. UI; + p<0.05 M UL vs. M UI. C) Correlations between body weight and height in CG, UL and UI female pups on PD 30 and D) in male pups. The r values for each experimental group and for the total are indicated, p<0.001. (n= 23 rats per condition).
Eyelid opening. The eyelid opening of female pups in CG, UL and UI experimental groups indicated significant differences only on PDs 13 and 14; U-test, z(24) =-3.96, p<0.0001 and z(24) =-3.67, p<0.0001. In the case of male pups, significant differences were found on PDs 13, 14 and 15; U-test, z(24) =-2.09,p<0.0359, z(24) =-5.16, p<0.0001 and z(24) =-2.00, p<0.0444
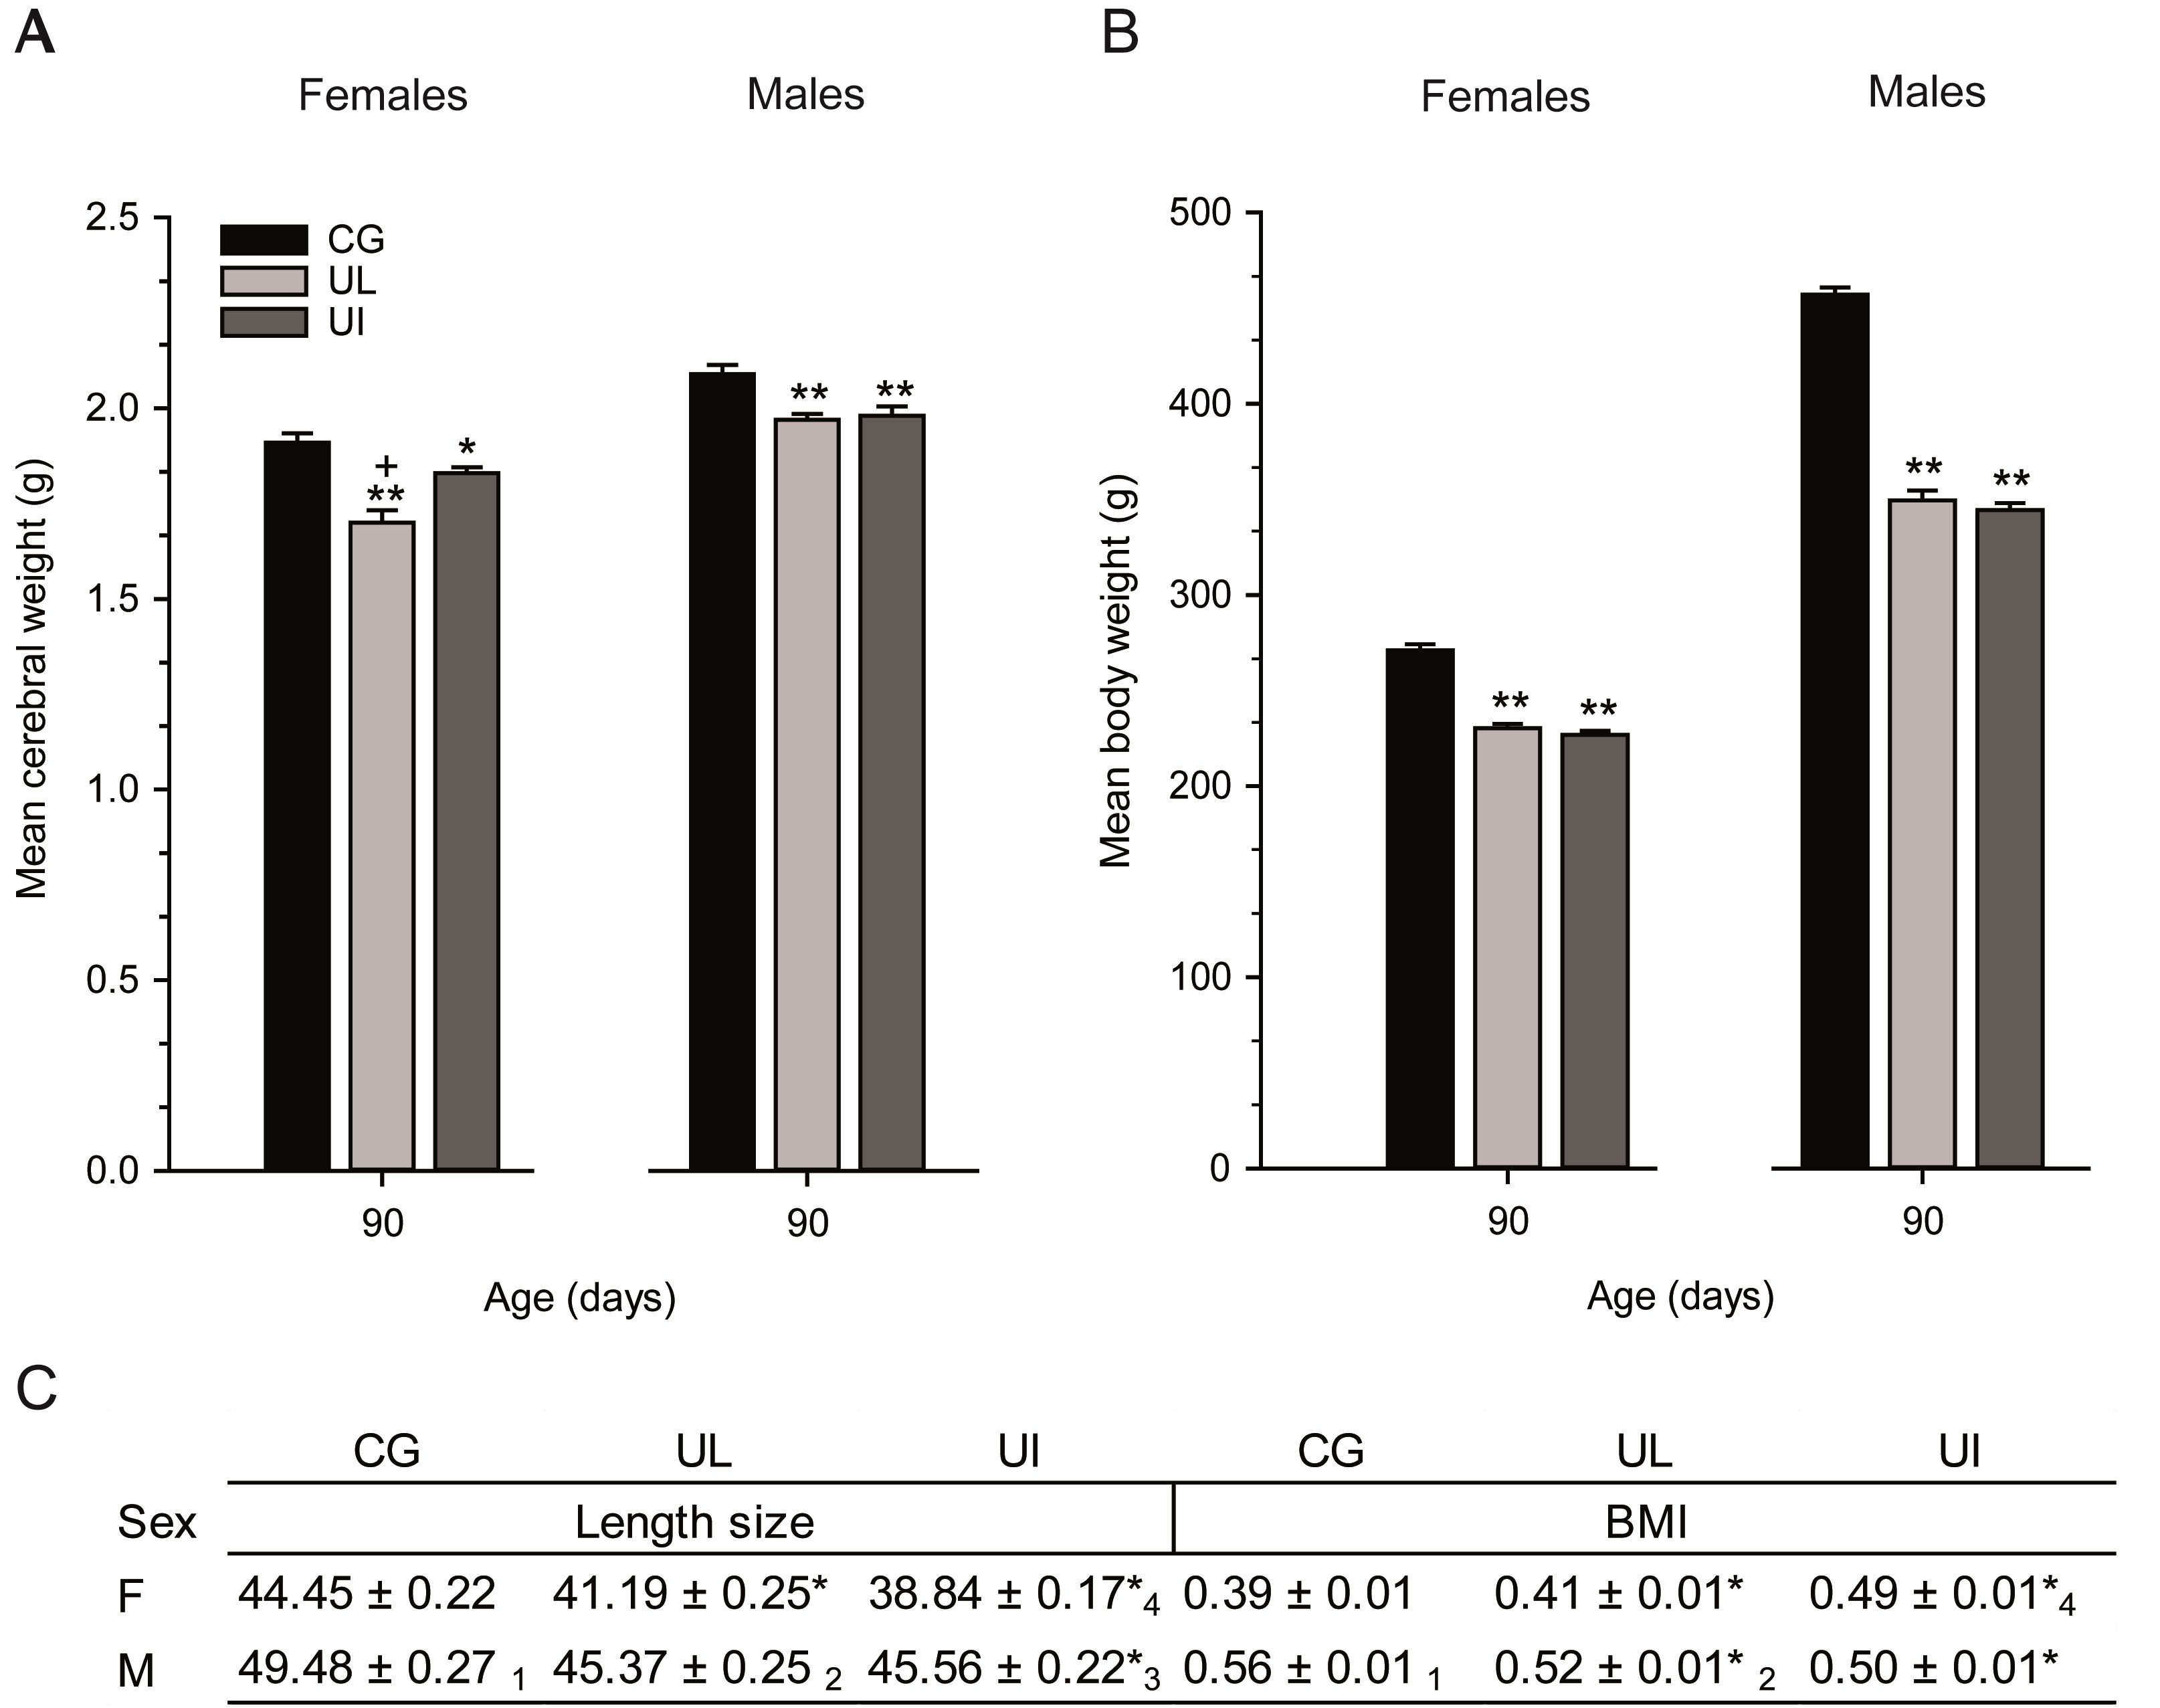
Figure 4. A) Mean (± SEM) cerebral weight on PD 90 in CG, UL and UI female and male rats (n=10 per condition). B) Mean body weight (n=23 per condition), * p<0.05 CG vs. UL or CG vs. UI; ** p<0.001 CG vs. UL or CG vs. UI; + p<0.001 F UL vs. F UI or M UL vs. M UI. C) Mean size and BMI (n=23 per condition), * p<0.001 CG vs. UL or CG vs. UI; (1) F CG vs. M CG; (2) F UL vs. M UL; (3) F UI vs. M UI; (4) F UL vs. F UI.
This study compared the effects of food restriction on physical development of F1 pups obtained from both UL and UI underfeeding paradigms until weaning and on ad lib balanced diet on PDs 30 and 90. Although both, with lower effects in the bitemporal axis. Furthermore, the mean body weight, body size and eyelid opening measurements of females and males in early underfed groups were significantly reduced during physical development. It is well known that during gestation, the mother transduces environmental information, such as nutritional status, to her embryo or fetus through the placenta or to her infant during lactation.36,37 In this regard, the UL and UI dietary paradigms significantly reduced the physical development of the skull and the bitemporal axis, as well as brain weight, even on PD 90, possibly reflecting an impairment of brain development with long-term consequences on plastic neuronal and cognitive responses.38-40 These results are in line with studies on prenatal and suckling food restriction in rodents, which showed impairments in the skull shape and head size due to arrested lengths in skull bones associated with the vault, basicranium skull and brain size development.27,30 Furthermore, present findings of reduced skull and head size may possibly have late neuroendocrine consequences because of the negative impacts of early undernutrition on the hypothalamic-pituitary axis and its endocrine target development. Thus, permanent morphological and functional impairments in stress response, maternal response and sexual activity of rats, associated with skeletal pre- and postnatal undernutrition, have been described and are consistent with our findings.4,41-45
The present results also indicated significant reductions associated with the UL and UI paradigms in the nose-coccyx, tail, tarsus-metatarsus and phalange lengths in both sexes. These reductions were provoked by the arrested development of the skeletal bones that consistently impacted the body weight and size of the subjects.10 Basic physiological studies indicated that the neuromuscular-skeletal assembly is a relevant part of the anatomical substrate for the reception, transmission and integration of afferent sensory signals, and it is key in the elaboration of muscular tone, posture and coordinated body movements as adaptive responses to environmental demands.46 Consequently, the skeletal alterations here reported, and their associated soft tissues may interfere at different levels with several integrated processes involved in the reflex, posture and integrated neuromuscular activities. In this regard, early undernutrition significantly disrupted the development of swimming, locomotor patterns during infancy, self-grooming, play behavior or complex motoric responses of lactating dams such as nest building, retrieving of pups, and postural kyphotic and sexual motor activities under different environmental contexts, ages, endocrine, social and dietary conditions.29,42,43,47-51
Another point of interest concerns the comparisons of the different physical development measurements between types of underfeeding treatments and sexes. The nose-coccyx length parameter was more significantly affected by UL and UI paradigms in both sexes; followed by the skull and tail lengths, with less effects provoked by the UI treatment in both sexes. The tarsus-metatarsus and phalange lengths were significantly affected by the UL with 50% less in both sexes than the UI group. The bitemporal axis was the head measurement least affected by the UL and UI dietary treatments. Our findings showed that both UL and UI protocols interfered with physical developmental, with lesser effects on the tarsus-metatarsus and phalange measures provoked by the UI in both sexes. Dietary treatments involved different degrees of mother-litter bond interactions in F1 pups including manipulation and sensory deprivation, particularly in the UI treatment. These findings suggested that these dietary maneuvers may affect physical development except in the tarsus-metatarsus and phalange parameter, affecting only 50% of rats of both sexes in the UI but not in the UL condition.
The correlation findings showed the gradual relationship between the body weight gain following the respective dietary treatment, and the proportional growth in the size length of both female and male rats on PD 30, assigned as the last day of the short-term period of physical development. However, because no significant differences were found in the BMI from PDs 5 to 30, these results proved, as in the correlation analyses, a lower physical growth, proportional to the subjects’ current body size due to the reduce food intake during the gestational and/or postnatal period. However, in the long-term period at PD 90, a rise in the BMI was detected only in the UI female subjects. This result may indicate an augmentation in the proportions of muscle and/or adipose tissue. Some findings suggested that malnutrition had an impact on the DNA content of muscle, experiencing early fatigability, with a serious decline in amplitude in rats subjected to nutritional stress during the lactation period.52 Moreover, increased adipose tissue storage could be due to an impaired sensing of hormonal and metabolic cues mediated by the neuronal systems as hypo- and hypercaloric diets during the postnatal period.53,54 Moreover, some hypothalamic neuronal secretions that mediate feeding behavior, such as the NPY and POMC neurons in the arcuate nucleus (ARC), can be regulated by perinatal environmental factors that can lead to obesity in adulthood,55,56 and this HPA axis impairment may affect mainly females, as our results indicated. The UL subjects showed an adequate BMI; however, further analysis covering longer periods of life are required to observe the real effect of perinatal undernutrition on muscle and adipose tissue functions.
Because the body weight and size length remained reduced in UL and UI rats throughout their life span, the cerebral weight also had a negative impact on both experimental groups on PD 90. Additionally, the brain weight reduction may correlate with the long-term deficiencies in cognitive and social interactions, as well as altered motor function.57
Although the UL and UI paradigms clearly interfered with the short and long-term physical development, the effects of early sensory stimulation, the supplemental diets during lactation and/or post-weaning periods, and their correlation with brain development are required to identify rehabilitation mechanisms of early food restriction.
Supported by DPAGA/UNAM IN200317 and CONACYT scholarship 632240 to C. Salcedo and scholarship 660096 to M. Ortiz-Valladares, a doctoral student of the Programa de Doctorado en Ciencias Biomédicas, Universidad Nacional Autónoma de México. We thank Jessica González Norris for editorial assistance.
No potential conflict of interest was reported by the authors.
1. Einstein FH. Multigenerational effects of maternal undernutrition. Cell Metab. 2014 19: 893–894
2. Danchin É, Charmantier A, Champagne F,Mesoudi A, Pujol B, Blanchet S. Beyond DNA: integrating inclusive inheritance into an extended theory of evolution. Nat. Rev. Genet. 2011 12: 475–486.
3. Felix J, Regalado M, Torrero C, Salas M. Retrieval of pups by female rats undernourished during the pre–and neonatal period. J. Behav. Brain Sci. 2014 4:325–333.
4. Kehoe P, Mallinson K, Bronzino J, McCormick CM. Effects of prenatal protein malnutrition and neonatal stress on CNS responsiveness. Dev. Brain Res. 2001 132:23–31.
5. Kuhn CM, Butler SR, Schanberg SM. Selective depression of serum growth hormone during maternal deprivation in rat pups. Science. 1978 201: 1034–1036
6. Vieau D, Sebaai N, Léonhardt M, Dutriez-Casteloot I, Molendi-Coste O, Laborie C, Breton C, Breton C, Lesage J. HPA axis programming by maternal undernutrition in the male rat offspring. Psychoneuroendocrinology. 2007 32: 16-20
7. Jansson T, Powell TL. Role of placental nutrient sensing in developmental programming. Clin. Obstet. Gynecol. 2013 56: 591–601.
8. Díaz P, Powell TL, Jansson T. The Role of Placental Nutrient Sensing in Maternal-Fetal Resource Allocation. Biol. Reprod. 2014 91:1-10.
9. Horton R. Maternal and child undernutrition: an urgent opportunity.Lancet. 2008 371:179
10. Belkacemi L, Nelson DM, Desai M, Ross MG. Maternal Undernutrition Influences Placental Fetal Development. Biol. Reprod. 2010 331:325–331.
11. Anderson GD, Ahokas RA, Lipshitz J, Dilts PVJ. Effect of maternal dietary restriction during pregnancy on maternal weight gain and fetal birth weight in the rat. J. Nutr.1980 110: 883–890.
12. Molina-Font J. Nutrition and fetal growth. Early Hum. Dev. 1998 53: 51-60.
13. Reynolds S, Millette A, Devine DP. Sensory and Motor Characterization in the Postnatal Valproate Rat Model of Autism. Dev Neurosci-basel. 2012;34(2-3):258-267.
14. Harding J E, Johnston BM. Nutrition and fetal growth. Reprod. Fertil. Dev. 1995 7:539–547
15. Aláez C, Calvo R, Obregón MJ, Pascual Leone AM. Thyroid hormones and 5’-deiodinase activity in neonatal undernourished rats. Endocrinology. 1992 130: 773–779.
16. Ayala-Moreno R, Racotta R, Anguiano B, Aceves C, Quevedo L. Perinatal undernutrition programmes thyroid function in the adult rat offspring. Br. J. Nutr. 2013 110: 2207-2215.
17. Murmu MS, Salomon S, Biala Y, Weinstock M, Braun K, Bock J. Changes of spine density and dendritic complexity in the prefrontal cortex in offspring of mothers exposed to stress during pregnancy. Eur. J. Neurosci. 2006 24:1477–1487
18. Mckay JA, Mathers JC. Diet induced epigenetic changes and their implications for health. Acta Physiol. 2011 202:103–118
19. Jiménez-Chillarón JC, Díaz R, Martínez D, Pentinat T, Ramón-Krauel M, Ribó S, Plösch, T. The role of nutrition on epigenetic modifications and their implications on health. Biochimie. 2012 94:2242–2263.
20. Zeisel SH. Epigenetic mechanisms for nutrition determinants of later health outcomes. Am. J. Clin. Nutr. 2009 89:1488-1493.
21. Smart JL, Adlard BPF, Dubbing J. Further studies of body growth and brain development in “small-for-dates” rats. Neonatology. 1974 25: 135–150
22. Jaiswal AK, Upadhyay SK, Satyan KS,Bhattacharya SK. Comparative effects of prenatal and postnatal undernutrition on learning and memory in rats. Indian J. Exp. Biol. 1999 37: 17–22.
23. Rice D, Barone S. Critical periods of vulnerability for the developing nervous system: Evidence from humans and animal models. Environ. Health Perspect. 2000 3:511-533.
24. Herlenius E, Lagercrantz H. Development of neurotransmitter systems during critical periods. Exp. Neurol. 2004 190:8–21.
25. Hardikar A, Satoor S, Karandikar M, Keech A, Jekins A, Yajnik C. Multigenerational undernutrition increases susceptibility to obesity and diabetes that is not reversed after dietary recuperation. Cell Metab. 2015 22: 312–319.
26. Bedi KS, Birzgalis AR, Mahon M, Smart JL, Wareham AC. Early life undernutrition in rats. 1. Quantitative histology of skeletal muscles from underfed young and refed adult animals. Br. J. Nutr. 1982 47:417–431..
27. Pucciarelli HM, Oyhenart EE. Effects of maternal food restriction during lactation on craniofacial growth in weanling rats. Am. J. Phys. Anthropol. 1987 72: 67–75
28. Warren M, Bedi KS. The effects of a lengthy period of undernutrition on food intake and on body and organ growth during rehabilitation. J. Anat. 1985 141:65–75.
29. Woodall SM, Breier BH, Johnston BM, Gluckman PDA. Model of intrauterine growth retardation caused by chronic maternal undernutrition in the rat: Effects on the somatotrophic axis and postnatal growth. J. Endocrinol. 1996 150: 231–242.
30. Barbeito-Andrés J, Gonzalez P, Hallgrímsson B. Prenatal development of skull and brain in a mouse model of growth restriction. Rev. Argentina Antropol. Biológica. 2016 18: 1–13.
31. Committee on Guidelines for the Use of Animals in Neuroscience and Behavioral Research (National Research Council). Guidelines for the care and use of mammals in neuroscience and behavioral research. Book (National Academies Press, 2003). doi:https://10.17226/10732.
32. Khan-Merchant N, Penumetcha M, Meilhac O, Parthasarathy S. Oxidized fatty acids promote atherosclerosis only in the presence of dietary cholesterol in low-density lipoprotein receptor knockout mice. J. Nutr. 2002 132: 3256–3262.
33. Lynch A. Postnatal undernutrition: an alternative method. Dev. Psychobiol. 1976 9: 39–48.
34. Altman J, Bayer SA. Atlas of prenatal rat brain development. CRC Press, Boca Raton, Florida 1995 pp. 1-589.
35. Hughes PC, Tanner, JMA. longitudinal study of the growth of the black-hooded rat: methods of measurement and rates of growth for skull, limbs, pelvis, nose-rump and tail lengths. J. Anat. 1970 106: 349–370.
36. Gluckman PD, Hanson MA, Cooper C, Thornburg KL. Effect of In Utero and Early-Life Conditions on Adult Health and Disease. N. Engl. J. Med. 2008 359: 61–73.
37. Belkacemi L, Nelson DM, Desai M, Ross M G. Maternal undernutrition influences placental-fetal development. Biol. Reprod. 2010 83: 325–331.
38. Florian ML, Nunes ML. Effects of intra-uterine and early extra-uterine malnutrition on seizure threshold and hippocampal morphometry of pup rats. Nutr. Neurosci. 2011 14: 151–158.
39. Wu G, Bazer FW, Cudd TA, Meininger CJ, Spencer TE. Maternal nutrition and fetal development. J. Nutr. 2004 134: 2169–2172.
40. Salas M, Torrero C, Regalado M, Rubio L. Effects of perinatal undernutrition on the basilar dendritic arbor of the anterior cingulate pyramidal neurons in lactating dams. Acta Neurobiol. Exp. (Wars). 2015 75: 372–380.
41. Kennedy GC, Mitra J. Body weight and food intake as initiating factors for puberty in the rat. J. Physiol. 1963 166: 408–418.
42. Larsson K, Carlsson SG, Sourander P, Forrsstrom B, Hansen S, Henriksson B, Lindquist A. Delayed Onset of Sexual Activity of Male Rats Subjected to Pre and Postnatal Undernutrition. Physiol. Behav. 1974 3: 307–311.
43. Salas M, Torrero C, Regalado M, Perez E. Retrieving of pups by neonatally stressed mothers. Nutr. Neurosci. 2002 5: 399–405.
44. Curtis G, Sung J, Rogers J. Maternal influences on epigenetic programming of the developing hypothalamic-pituitary-adrenal axis. Birth Defects Res A Clin Mol Teratol. 2011 91: 797–805.
45. Batista TH, Veronesi VB, Ribeiro ACAF, Giusti-Paiva A, Vilela FC. Protein malnutrition during pregnancy alters maternal behavior and anxiety-like behavior in offspring. Nutr. Neurosci. 2017 20: 437–442.
46. Purves D, Augustine GJ, Fitzpatrick D, Hall WC, LaMantia AS, McNamara JO, White LE. En: Movement and its central control. Neuroscience Sinauer Ass. 5th edition 2012 pp. 353-435.
47. Altman J, Sudarshan K, Mccormick N. Neural and Behavioral Development : III. Development of Some Motor, Particularly Locomotor Patterns During Infancy. Dev. Psychobiol. 1971 4: 97–114.
48. Salas, M. Effects of early malnutrition on the development of swimming ability in the rat. Physiol. Behav. 1972 8: 119–122.
49. Harrison AP, Tivey, DR, Clausen T, Duchamp C, Dauncey MJ. Role of thyroid hormones in early postnatal development of skeletal muscle and its implications for undernutrition. Br. J. Nutr. 1996 76: 841–855.
50. Loranca A, Torrero C, Salas M. Development of play behavior in neonatally undernourished rats. Physiol. Behav. 1999 66: 3–10.
51. Salcedo C, Torrero C, Regalado M, Rubio L, Salas M. Effects of pre- and neonatal undernutrition on the kyphotic response and c-Fos activity in the caudal periaqueductal gray of primiparous lactating Wistar rats. Physiol. Behav. 2018 185: 87–94.
52. Raju NV. Effect of early malnutrition on muscle function and metabolism in rats. Life Sci. 1974 15 949–960.
53. Ravelli GP, Stein, ZA, Susser MW. Obesity in young men after famine exposure in utero and early infancy. N. Engl. J. Med. 1976 295: 349–353.
54. Faust IM, Johnson PR, Hirsch J. Long-term effects of early nutritional experience on the development of obesity in the rat. J. Nutr. 1980 110: 2027–2034.
55. Björntorp P, Holm G, Rosmond R. Hypothalamic arousal, insulin resistance and Type 2 diabetes mellitus. Diabet. Med. 1999 16:373–383.
56. Barness LA, Opitz JM, Gilbert-Barness E. Obesity: Genetic, molecular, and environmental aspects. in American Journal of Medical Genetics, Part A. 2007 143: 3016–3034
57. Clarke KA, Parker AJ, Smart JL. Analysis of walking locomotion in adult female rats undernourished as sucklings. Physiol. Behav. 1992 52: 823–826.
| Recibido: August 15, 2019 | Aceptado: October 19, 2019 |
Corresponding Author at: Department of Developmental Neurobiology and Neurophysiology, Institute of Neurobiology, Universidad Nacional Autónoma de México, Campus UNAM Juriquilla, Querétaro, Qro. México. Telephone number: 52 (55) 5623 40 59, (442) 238 10 59, Fax number: +52 (55) 56234005. E-mail: masal@unam.mx
Este es un artículo de libre acceso distribuido bajo los términos de la licencia de Creative Commons, (http://creamasal@unam.mxtivecommons.org/licenses/by-nc/3.0), que permite el uso no comercial, distribución y reproducción en algún medio, siempre que la obra original sea debidamente citada.