Development of a virtual instrument for integration of electrical nerve signals
- Inicio
- Comité Editorial
- Lineamientos
- Carta de Cesión de Derechos
- Información Legal
- Acerca de la Revista
- Bases de Datos
- Contacto
- ISSN 2007-3054
- Centro de Investigaciones Cerebrales
Universidad Veracruzana
Artículo de Investigación
Miguel Angel Landa-Jimenez1,2, Patricia Gonzalez-Gaspar1,2 Consuelo Morgado-Valle1,3, Leonor Lopez-Meraz1, Cesar A. Perez-Estudillo1, Luis Beltran-Parrazal1,3*.
1Centro de Investigaciones Cerebrales, Universidad Veracruzana, Xalapa., Ver., México 2Departmento de Inteligencia Artificial, Universidad Veracruzana, Xalapa, Ver., México 3Facultad de Medicina, Universidad Veracruzana, Xalapa, Ver., México.
Resumen/Abstract
Introducción
Material y métodos
Resultados
Discusión y conclusiones
Agradecimientos
Referencias
Correspondencia
El estudio del control neural del movimiento es un campo de gran interés para los neurocientíficos. Mediante el registro de señales eléctricas de nervios motores, los comportamientos rítmicos se pueden estudiar in vitro. Por ejemplo, en una rebanada transversal del tallo cerebral, un ritmo relacionado con la respiración puede ser registrado desde el nervio hipogloso (XIIn). Para obtener un análisis significativo del patrón y frecuencia respiratoria in vitro, es necesaria la integración de las señales eléctricas del XIIn. Mediante programación en LabView, hemos desarrollado un instrumento virtual para la integración de las señales eléctricas nerviosas. Mostramos que es posible la sustitución de instrumentos electrónicos caros por un instrumento virtual con la misma o mayor funcionalidad.
Palabras clave: LabView, Programación, Ritmo respiratorio, Electrofisiología, Instrumento virtual.
The study of ther neural control of movement is a field of considerable interest for neuroscientists. By recording electrical signals from motor nerves, rhythmic behaviors can be studied in vitro. For example, in a brainstem transverse slice, a respiratory-related rhythm can be recorded from the hypoglossal nerve (Xlln). To obtain a meaningful analysis of the in vitro respiratory pattern and frequency. Integration of the XIIn electrical signals is necessary. Here, by programming in LabView, we developed a virtual instrument for integration of nerve electrical signals. We show that it is possible replacing expensive electronic instruments by a virtual instrument whit the same or greater functionality.
Key words: LabView, Programming, Respiratory rhythm, Electrophysiology, Virtual instrument.
The study of rhythmic movements controlled by the nervous system is a matter of interest in neuroscience.1 The neural control of rhythms such as breathing and locomotion can be studied in in vitro preparations in which the rhythm-generating networks transmit electrical signals to a motor nucleus.2,3 By using a suction electrode and an amplifier, the extracellular activity of motoneurons can be recorded from the nerve that acts as a motor output.
To obtain meaningful information regarding period, amplitude and phase from motor output recordings, nerve electrical signals are integrated. Integration is the process of performing a first-order low-pass filter with respect to time. To perform signal integration an electronic instrument is required, i.e., an integrator that receives the electrical signal as input. Analog integrators are not commercially available instruments. Custom-made integrators are expensive and usually the user has to wait several months of manufacturing.
Here we aimed to develop a virtual instrument for signal integration. We tested our virtual instrument integrating rhythmic respiratory-related hypoglossal nerve activity. Our virtual instrument does not introduce electrical noise, is portable, allows offline processing, and has a user-friendly interface. Once the signal is integrated, our virtual instrument performs data analysis that can be easily exported. We suggest our virtual instrument as a viable alternative for analog integrator substitution particularly in low-resource settings.
Electrophysiological nerve recording
Signals were obtained from neonatal (0-3 days-old) rat transverse slices that generate respiratory-related motor output.4 Experiments were performed according to the Norma Oficial Mexicana (NOM)-062-ZOO-1999 and NIH Guidelines for the Euthanasia of Rodent Fetuses and Neonates (http://oacu.od.nih.gov/ARAC/). Neonatal rats were anesthetized using isoflurane in a vaporizer. The dissection was performed in artificial cerebrospinal fluid (ACSF) containing (in mM): 128 NaCl, 3 KCl, 1.5 CaCl2, 1 MgS04, 23.5 NaHCO3, 0.5 NaH2PO4 and 30 glucose, bubbled with 95% O2/ 5% CO2 at 27° C. Respiratory-related motor output was recorded from hypoglossal nerve (XIIn) using fire-polished glass suction electrodes and a differential amplifier. Electrophysiological signals were acquired digitally at 4-20 kHz using pCLAMP software and a Digidata 1200 AD/DA board (Molecular Devices, Sunnyvale, CA). Files in .abf format were obtained. Figure 1 shows a diagram of the generation, acquisition and processing of the electrical signal of interest using the virtual instrument.
Virtual instrument
The virtual instrument was programmed in LabVIEW 2011 (National Instruments) on a PC with an Intel Core i7-2600k 3.4GHz processor and Windows 7 operating system. In order to load files in .abf format we programmed the virtual instrument with the library provided by National Instruments (http://zone.ni.com/devzone/cda/epd/p/id/5979).
Before integration the virtual instrument filtered and rectified the signal. Signal filtering was performed with a nonlinear median filter. The median filter combined low-pass and high-frequency filter characteristics. The low-pass filter parameters allowed the median filter to remove high-frequency noise. The high-frequency filter parameters allow the median filter to detect edges, which preserves edge information.5
The median filter obtains the elements of filtered signal as shown in equation 1.
Eq. 1
yi= Median(Ji) for i=0, 1, 2,….,n-1
where y represents the output sequence of filtered signal, n is the number of elements in the input sequence x, Ji is a subset of the input sequence x centered about the ith element of x, and the indexed elements outside the range of x equal zero. The equation 2 describes Ji.
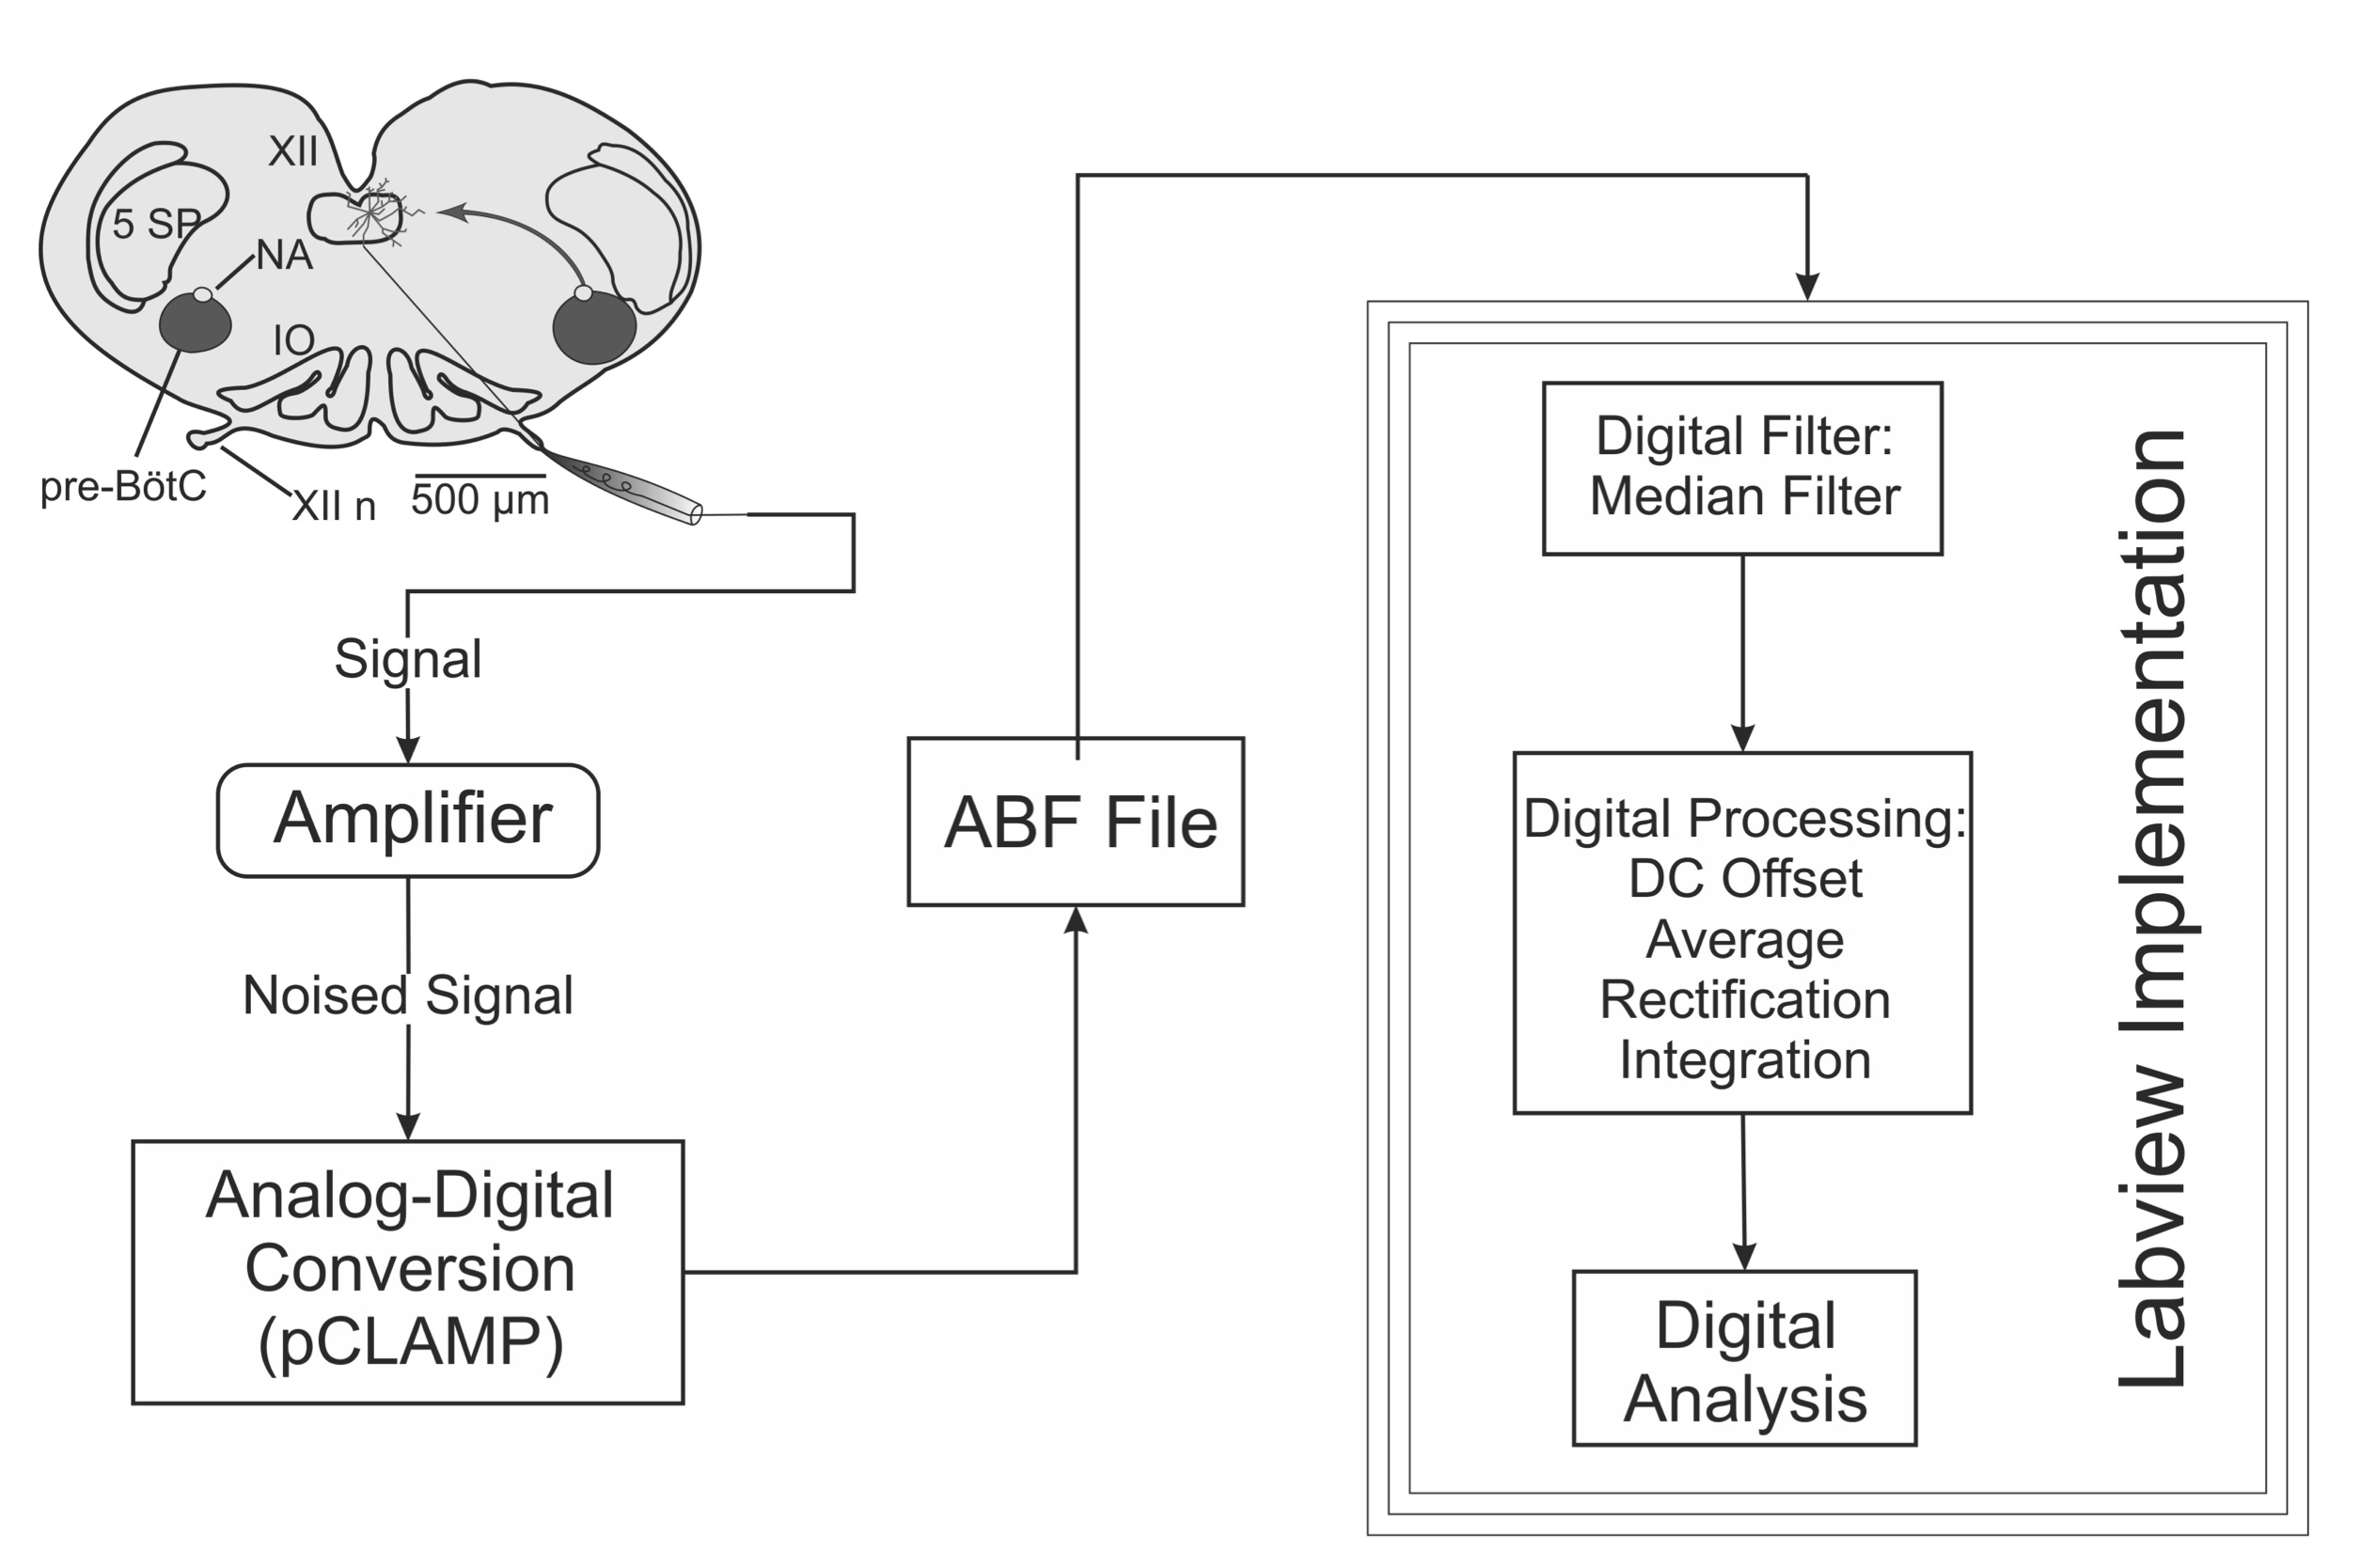
Figure 1. Path of the signal: from the nerve recording to the virtual instrument. The electrical signal from hypoglossal nerve is acquired using a suction electrode, an analog amplifier and a digitizer. Data in .abf format are loaded to the virtual instrument. Filtering, rectification and integration of the signal are performed by the virtual instrument.
Eq. 2
Ji=xi-rl,xi-rl+1,K,xi-1,xi,xi+1,K,xi+rr-1,xi+rr
where rl is the filter left rank, and rr is the filter right rank. Figure 2 shows the computation of yi.
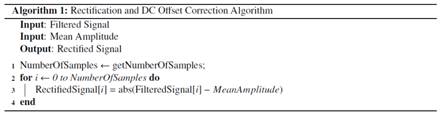
Rectification translates the signal to a single polarity to facilitating the signal processing. There are 2 types of rectification: full-wave rectification that adds the signal below the baseline (usually negative) to the signal above the baseline (all positive) and half-wave rectification that deletes the signal below the baseline. We used the full-wave rectification because it preserves all signal data for later analysis.
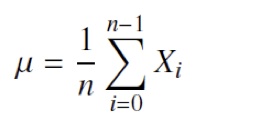
The rectification was performed by computing the absolute value of each sample in the signal. A DC offset correction was performed by subtracting the mean amplitude of the signal. The mean amplitude was calculated as shown in equation 3.
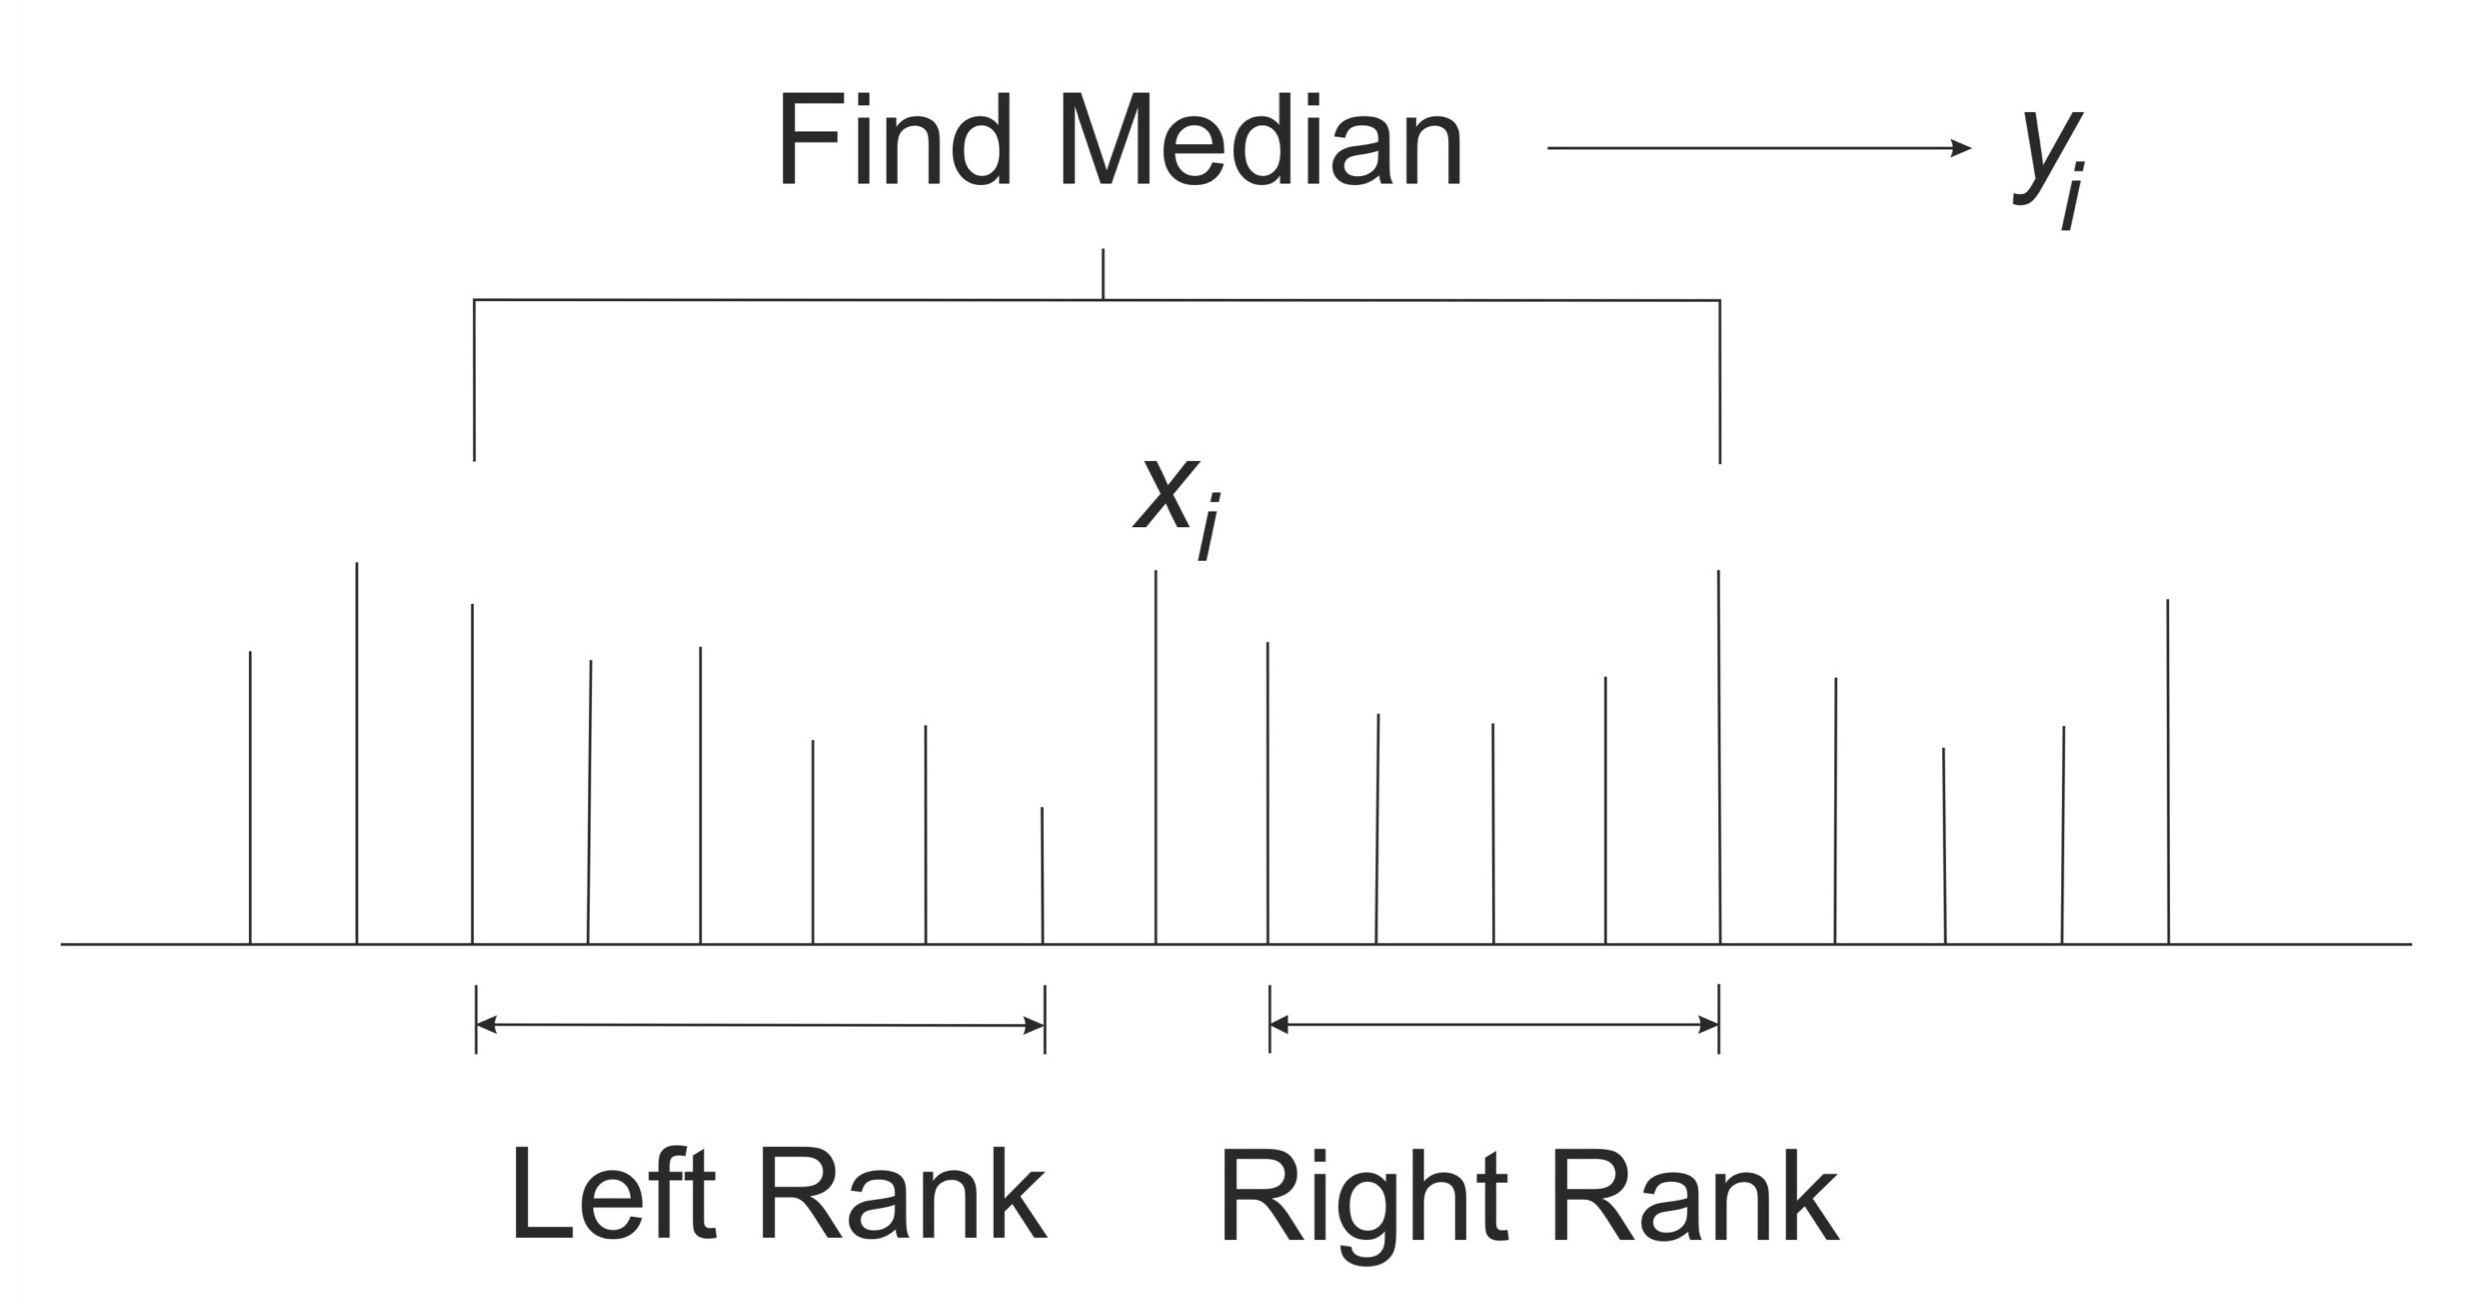
Figure 2. Computation of the median filter. For each point in the original signal, we select a window limited by the Left and Right Ranks. The new point is obtained by averaging the window.
Eq. 3
Integration
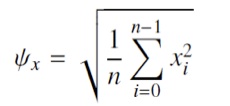
The virtual instrument integrates the rectified signal by performing a root mean square (RMS). The RMS is a statistical measure of magnitude of variable quantity and was calculated as the root of the mean of the squares of all samples in a signal:
Analysis of the integrated signal using the virtual instrument.
In order to perform statistical analysis of parameters such as period and amplitude, peak detection necessary. Our virtual instrument performs peak detection using a threshold set by the user. In order to be detected, the peaks must exceed the threshold. Once the peaks are detected their frequency is computed as follows:
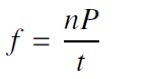
where nP is the number of peaks detected and t is the total signal duration in seconds. Period (T) is the reciprocal of frequency, therefore is calculated as shown in 6.
The virtual instrument we programmed is a tool for processing and analysis of electrophysiological nerve recordings with a user-friendly interface (Figure 3). Once the user is familiar with the interface and parameters, the time for processing and analysis of signals is greatly reduced. To facilitate analysis, we incorporated to our virtual instrument a module for peak detection. Since amplitude varies within recordings, we programmed the threshold for detection to be set by the user (Figure 3). A database containing peak parameters such as time, frequency and period can be saved in text file (.txt) format and emailed.
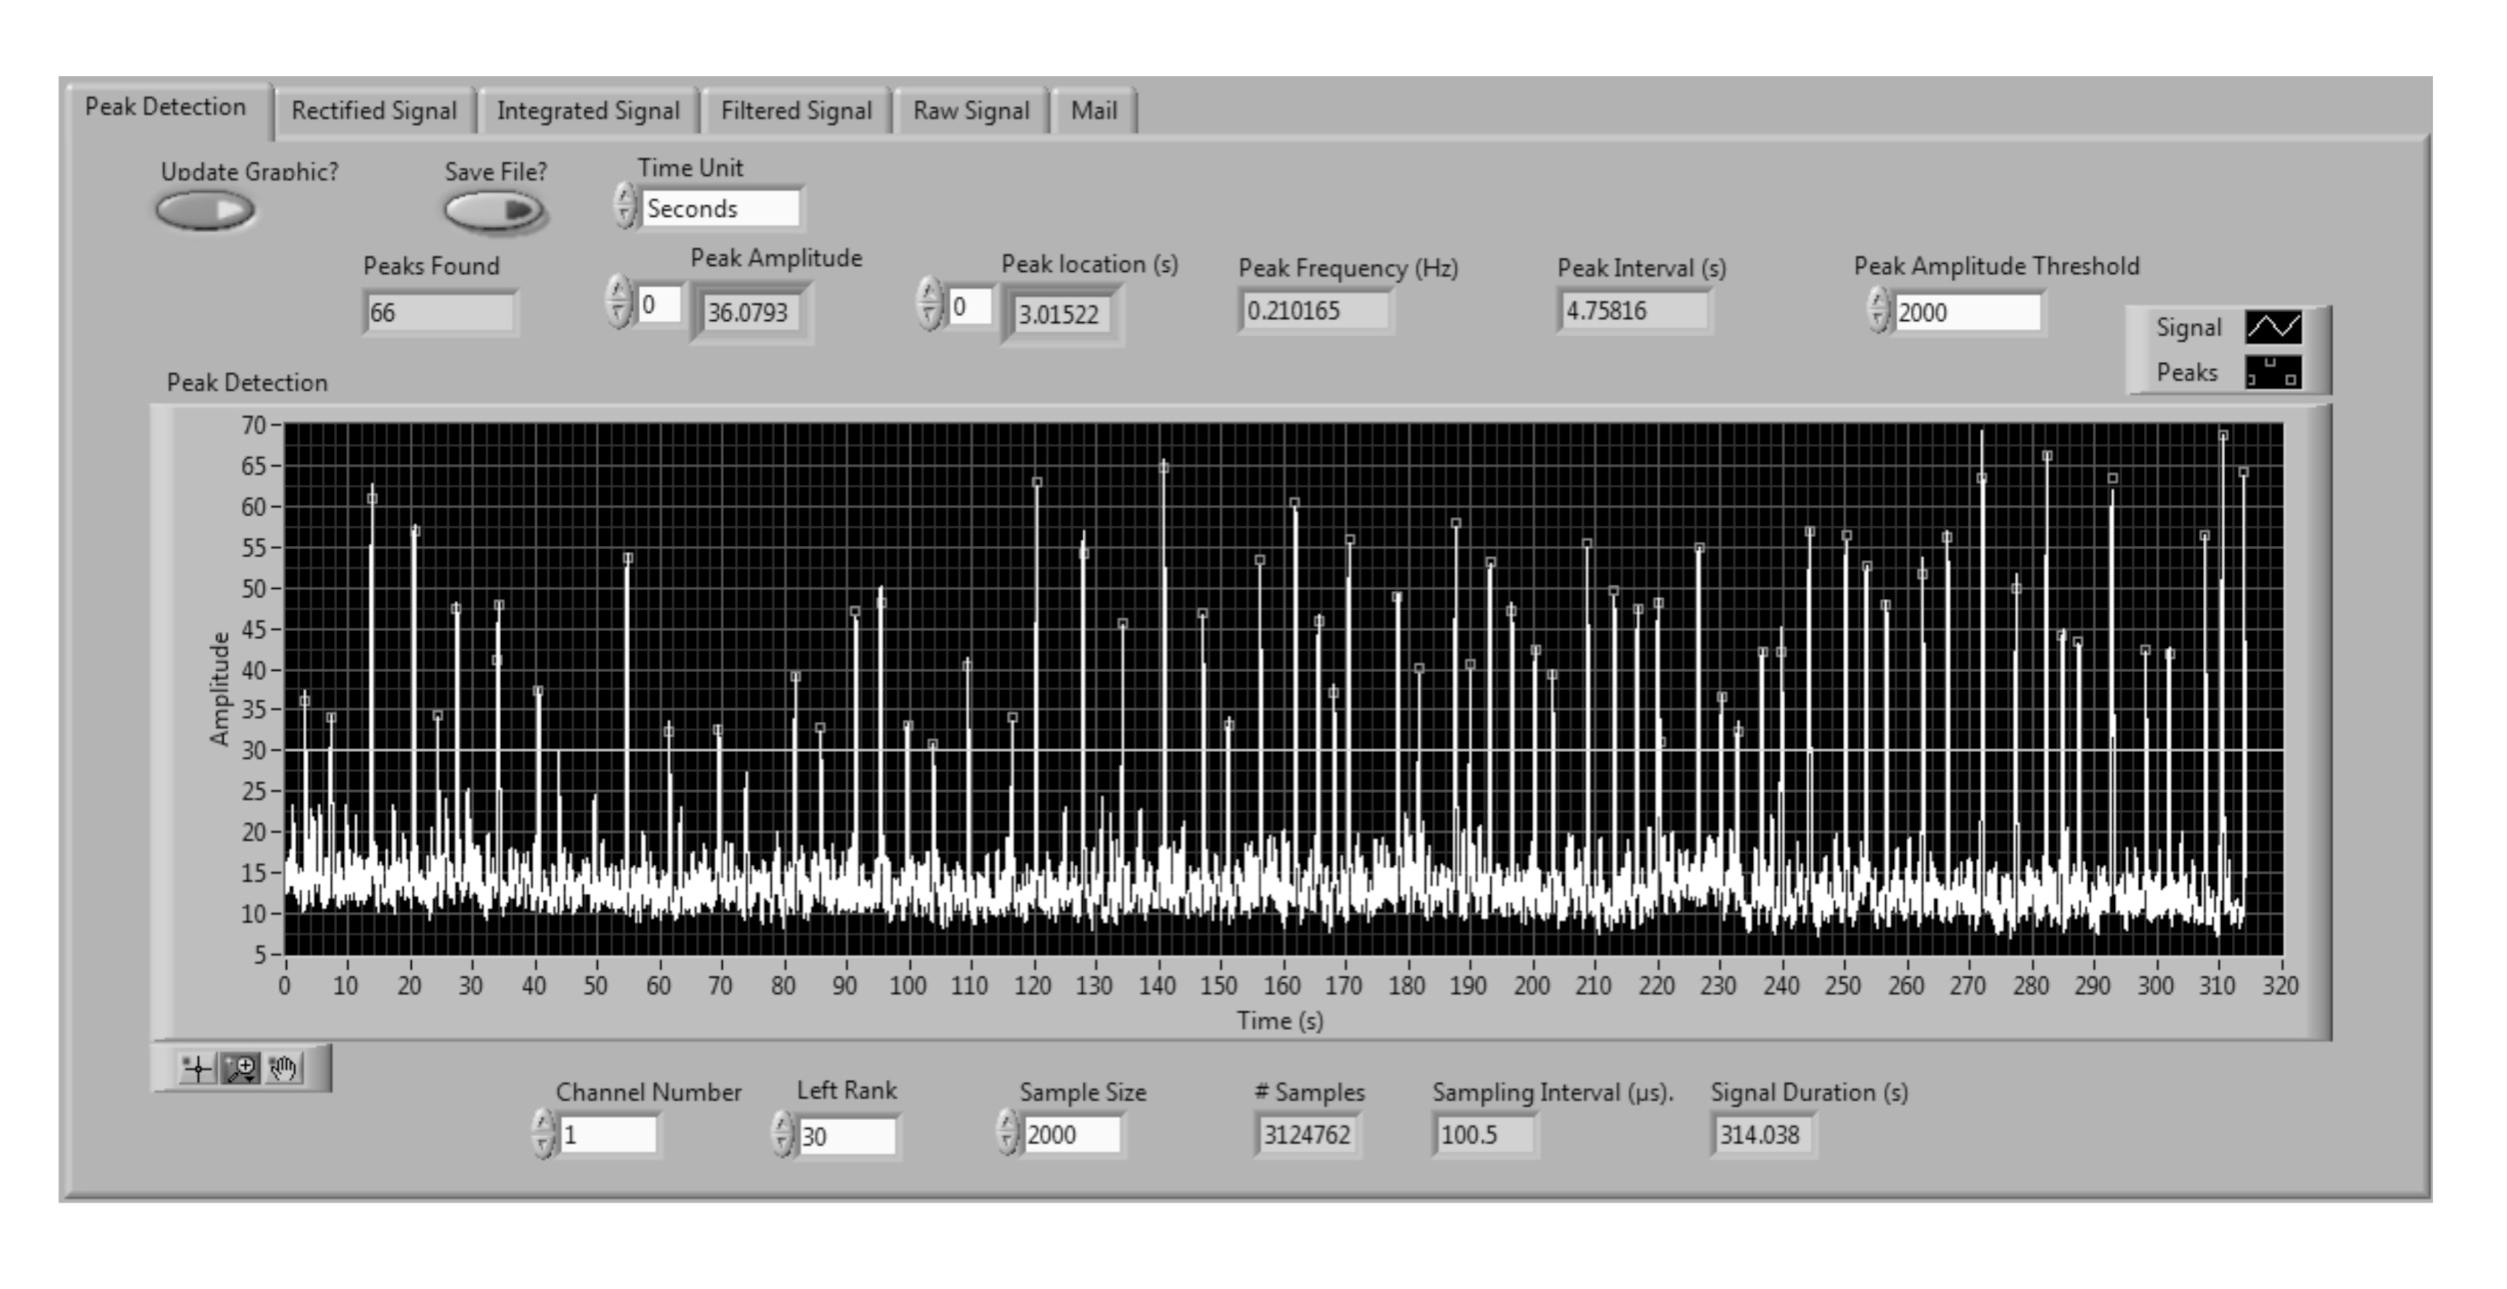 Figure 3. Virtual instrument interface. The virtual instrument has a user-friendly interface with 5 tabs (Peak detection, Rectified Signal, Filtered Signal, Raw Signal and Mail). We show the interface for Peak detection in an integrated signal. The interface allows the user easy visualization of relevant parameters. The Mail tab is used to send the analysis database via email. Peaks are shown as small circles in the signal. A threshold is set according to user’s needs. A database containing time, number, of peaks can be emailed.
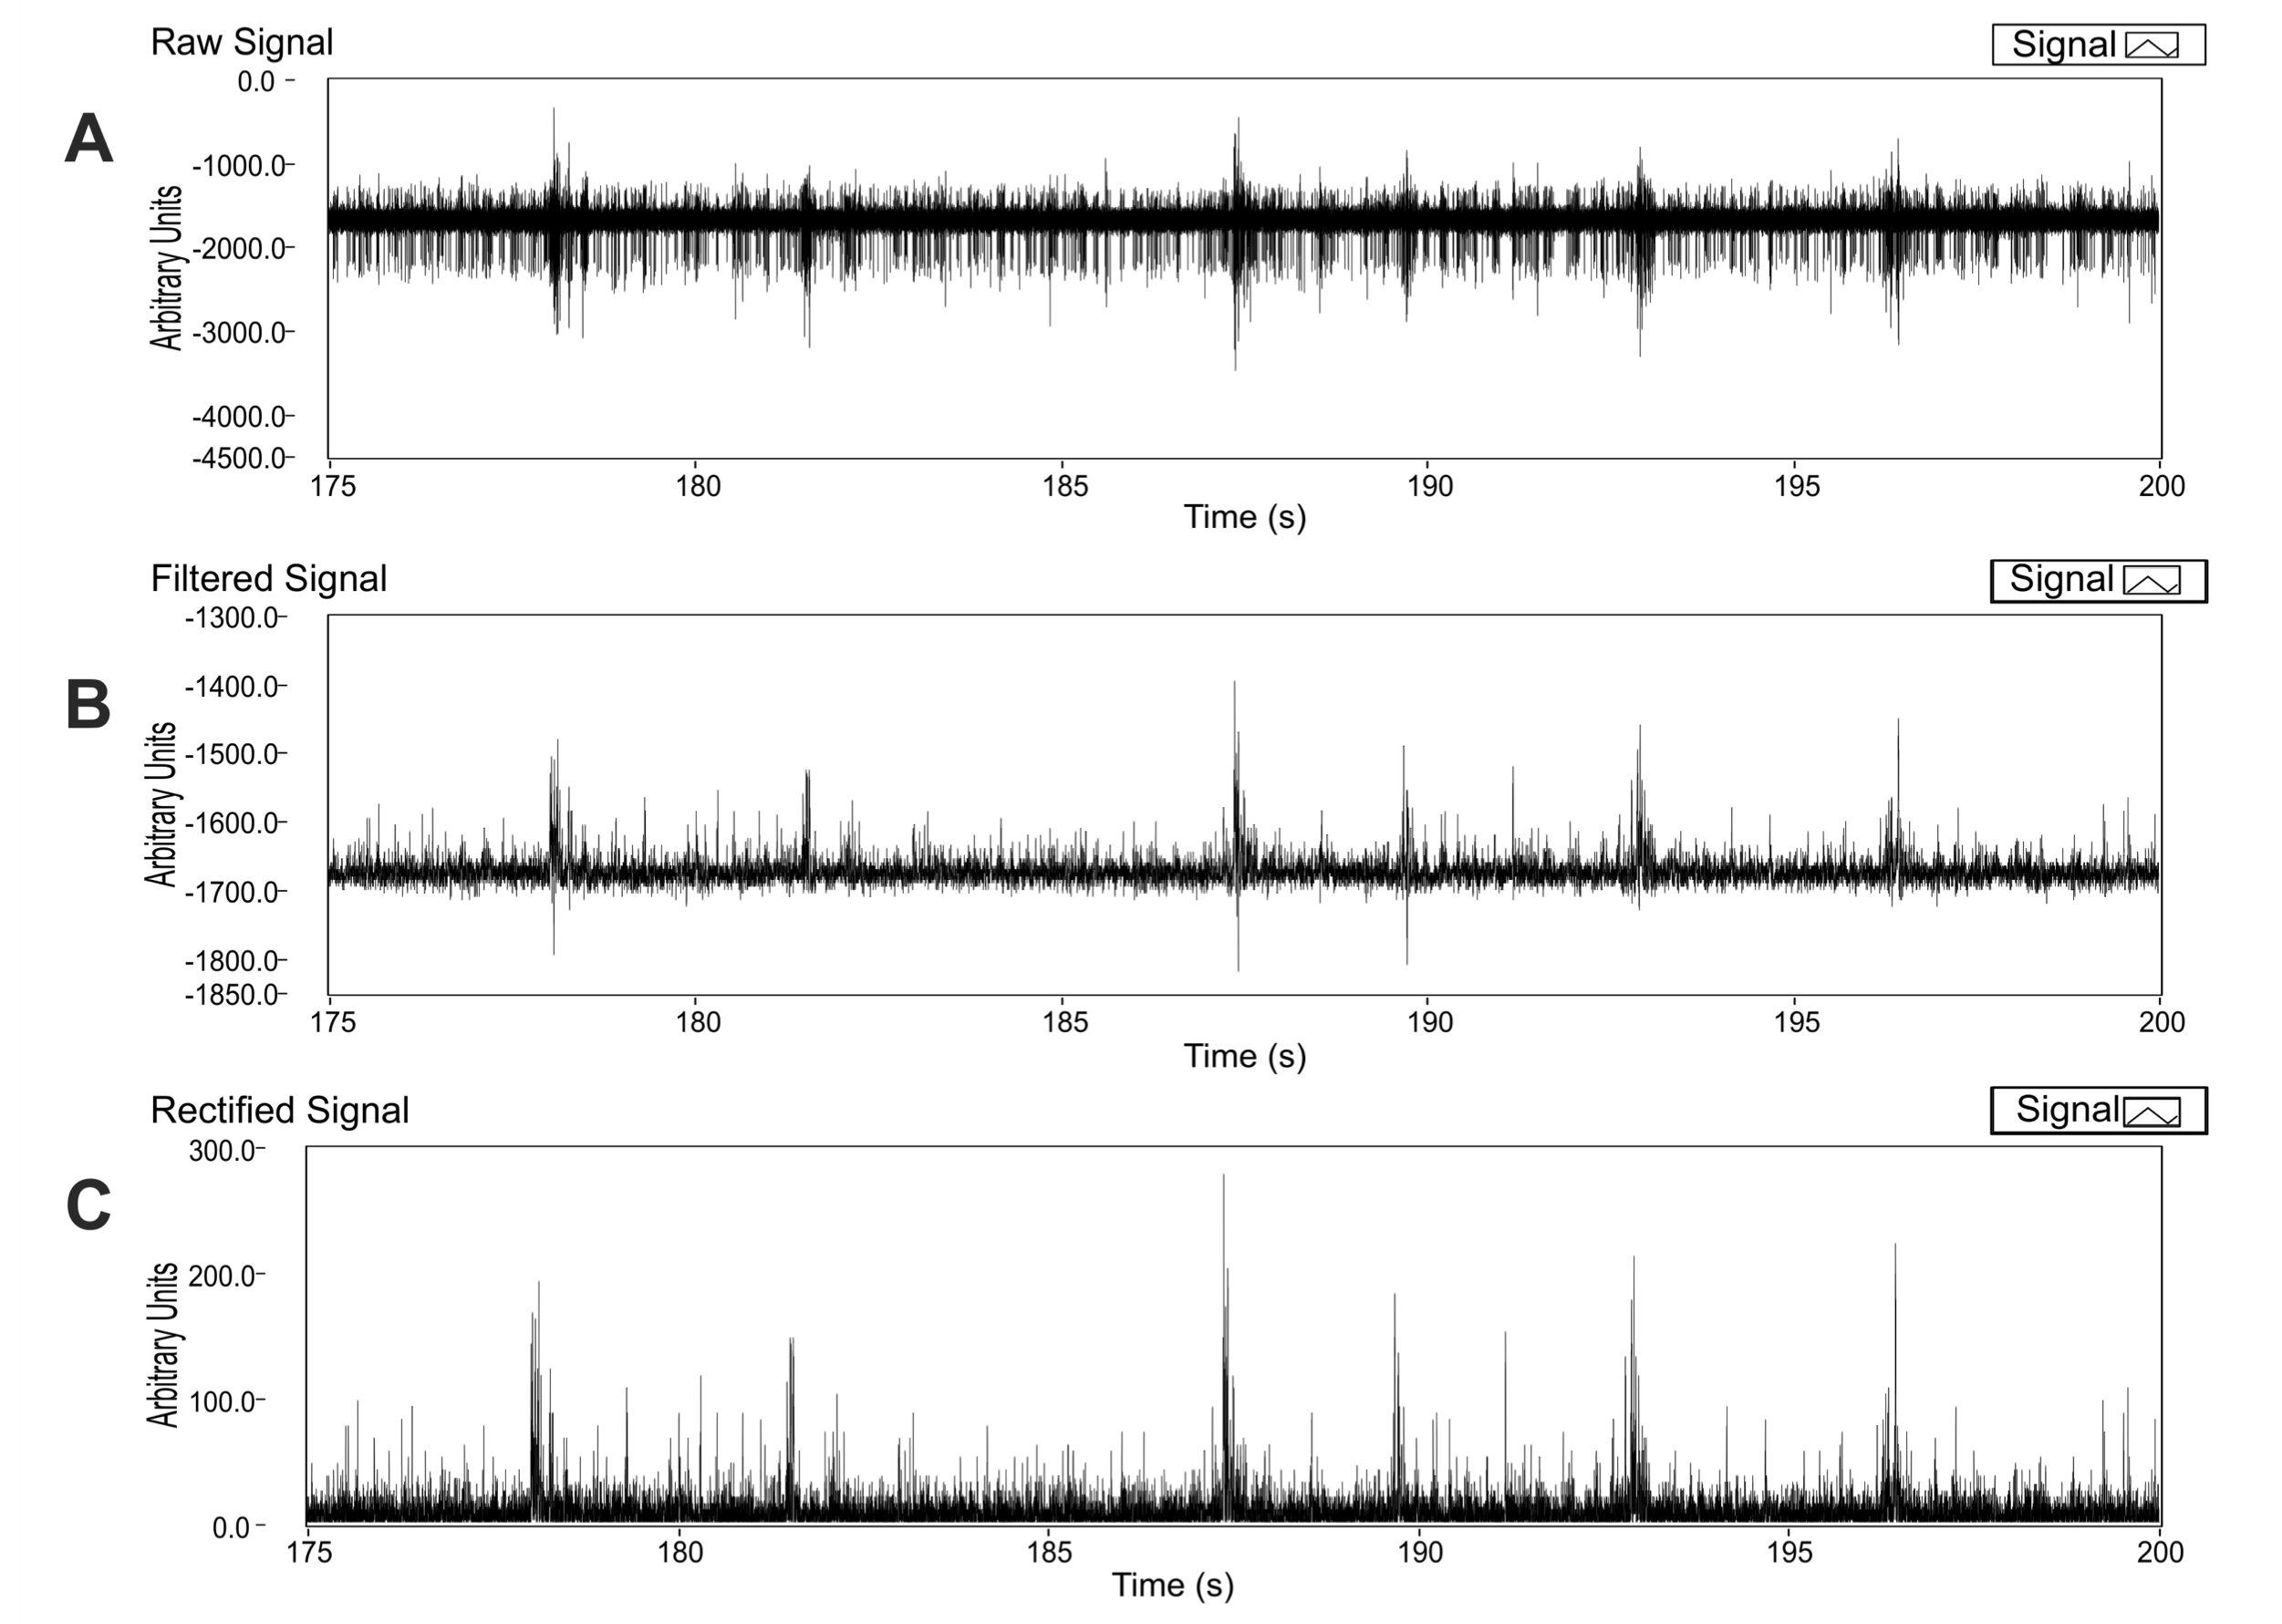
Figure 4. Signal processing: Filtering with a median filter. We applied a median filter to the signal (see text for details). We show a segment of 25 s of raw signal (A) and the resulting trace after filtering (B). Rectification. Once filtered, the signal was rectified by applying full-wave rectification and DC offset correction as show in algorithm 1. We show the resulting trace after rectification (C).
Rhythmic respiratory-related hypoglossal nerve (XIIn) recordings were obtained by suctioning the nerve with a suction electrode and amplified with a differential amplifier. The signal obtained is extracellular activity of motoneurons constituting the nerve (Figure 4A). A major advantage of our virtual instrument is that there is not need to convert the raw signal to .txt format. Files with .abf format were loaded to the virtual instrument. Since we are interested in analyzing only the rhythmic activity, the virtual instrument eliminates the high frequency spikes by applying a median filter to the raw signal (Figure 4B). Please note that, in rhythmic nerve recordings amplitude can only be compared within the same recording and not among different recordings. Amplitude mainly depends on the amount of motoneurons recruited, which is different among preparations. In the analysis of XIIn respiratory-related rhythm amplitude is often normalized, therefore units are arbitrary. The most relevant parameter to study respiratory rhythm generation is period.
Our virtual instrument was also programmed to rectify the signal by applying full-wave rectification and DC offset correction (Figure 4C; see Material and methods).
To show the effectiveness of our virtual instrument we compared the integration of the signal by both our virtual instrument and an analog integrator. To obtain the nerve signal, amplified nerve activity was split in two: 1) to feed an analog integrator before entering the digitalizing board and 2) to be acquired digitally as raw data by the digitalizing board. A segment of the raw signal in .abf format was integrated by the virtual instrument and compared against the same segment of the analog integrated signal. The virtual instrument detected the same peaks of interest as the analog integrator. We did not found statistical differences in period or normalized peak amplitude (Figure 5).
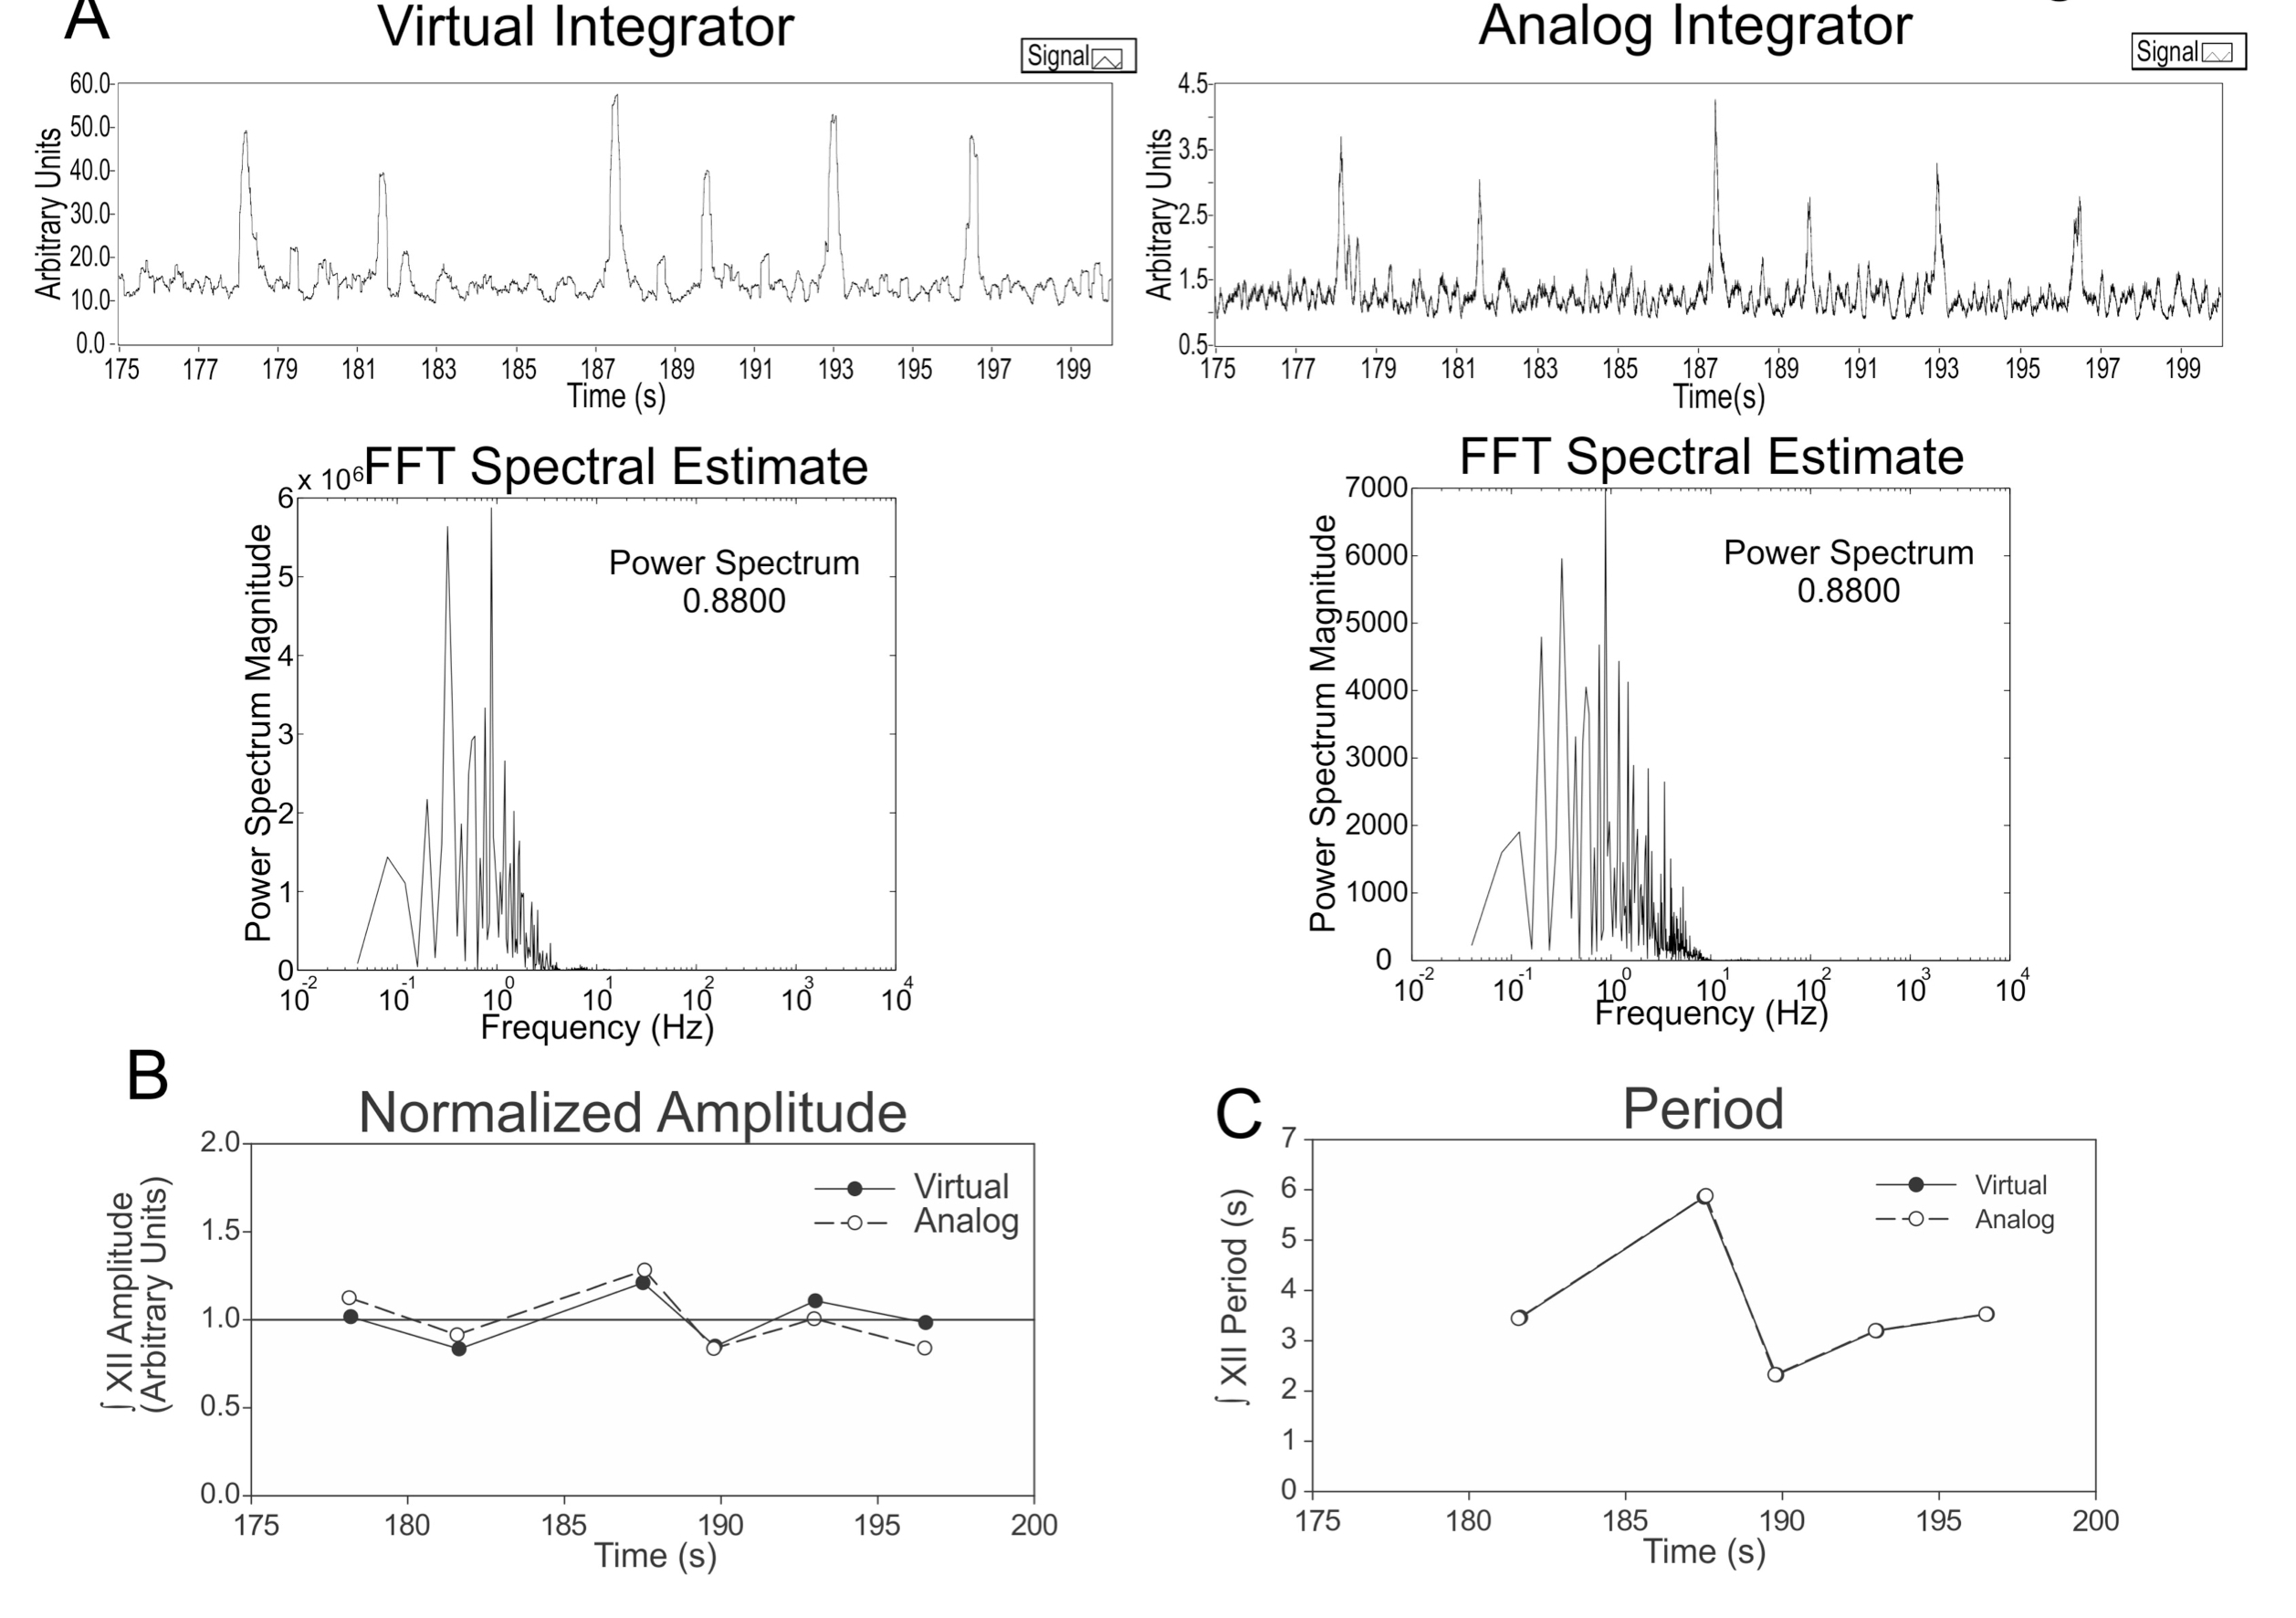
Figure 5. Comparison of virtual instrument and analog integration. A (Left): Segment of signal integrated with our virtual instrument. In the bottom we show the spectral analysis. (Right) We show the same segment of signal integrated with the analog integrator. Bottom shows the respective spectral analysis. Note that power spectra for both signals are the same. B: Comparison of peak amplitudes from both signals. The amplitude was normalized with respect to the mean amplitude of peaks in the segment for comparison purposes. C: Comparison of period between peaks from both signals. Period is the same in both signals as expected.
Here we show the successful virtualization of an analog instrument for integration of electrical nerve signals. Particularly in low resource settings, we propose virtualization as an alternative for replacing expensive electronic instruments to obtaining the same or greater functionality.
Why virtualizing an analog instrument?
Development of virtual instruments ensures not only that applications developed will be helpful in the future but also provides the flexibility to adapt and extend the system depending on user's new requirements and changes or updates of the computer equipment. Data acquisition and analysis directly into the computer allows a more efficient use of resources and time used in the experiments.
One of the main advantages of the digital integrator over the analog integrator is that our virtual instrument allows storing data in the computer's hard drive for post-processing. When compared with an analog integrator, the virtual instrument has other advantages such as inexpensive implementation, stability, less sensitivity to environment effects that may damage the signal (e.g., humidity, temperature, etc.), and does not introduce errors due to electrical noise or defective circuits.
Our virtual instrument prevents disadvantages of the analog integrator such as limited data processing speed, adaptation to new hardware, etc. The virtual instrument that we developed simplifies the whole process of signal analysis, from acquisition to peak detection.
Processing the signal
When analyzing low frequency biological rhythms such as breathing or locomotion, elimination of noise in form of high frequency is desirable. Our virtual instrument is programmed to reducing high frequencies by filtering the signal. This processing delivers a sharp signal without losing data.
In in vitro preparations that involve electrical recording of nerves, amplitude is not comparable among different experiments. Changes in amplitude are only measurable within the same recording, e.g., before and after a pharmacological treatment. In order to facilitate analysis, we programmed our virtual instrument with a peak detection module that allows the user to setting a threshold for peak detection according to the needs in each experiment. This is a non-trivial advantage of the virtual instrument, which acts as an integrator and an analysis software.
In conclusion, it is possible replacing an analog integrator by a virtual instrument with the same or greater functionality. This is a step to virtualizing other instruments and also to replacing proprietary software for signal processing and analysis with software developed by the user.
This research was supported by CONACYT grants (LBP) 128392 and (CMV) 153627 and fellowships CONACYT (MLJ) 258942 and (PGG) 259846. All the source codes are available upon request from authors. Source code and hardware information are distributed under the GNU General Public License (GPL, version 3).
- Schwab DJ, Bruinsma RF, Feldman JL, Levine AJ. Rhythmogenic neuronal networks, emergent leaders, and k-cores. Phys Rev E Stat Nonlin Soft Matter Phys 2010 82: 051911.
- Grillner S, Wallen P, Saitoh K, Kozlov A, Robertson B. Neural bases of goal-directed locomotion in vertebrates--an overview. Brain Res Rev 2008 57: 2-12.
- Feldman JL, Del Negro CA, Gray PA. Understanding the rhythm of breathing: so near, yet so far. Annu Rev Physiol 2013 75: 423-52.
- Smith JC, Ellenberger HH, Ballanyi K, Richter DW, Feldman JL. Pre-Botzinger complex: a brainstem region that may generate respiratory rhythm in mammals. Science, 1991 254: 726-9.
- Corporation NI. LabVIEW Analysis Concepts. National Instruments 2004.
| Recibido: 21 de febrero de 2014 | Aceptado: 04 de abril de 2014 |
Correspondencia:
*Centro de Investigaciones Cerebrales, Universidad Veracruzana, Berlin 7. Fracc. Montemagno Animas, Xalapa, Ver. C.P. 91190 Phone: +52(228) 8418900 Ext 16303 email: lubeltran@uv.mx
Este es un artículo de libre acceso distribuido bajo los términos de la licencia de Creative Commons, (http://creativecommons.org/licenses/by-nc/3.0), que permite el uso no comercial, distribución y reproducción en algún medio, siempre que la obra original sea debidamente citada.